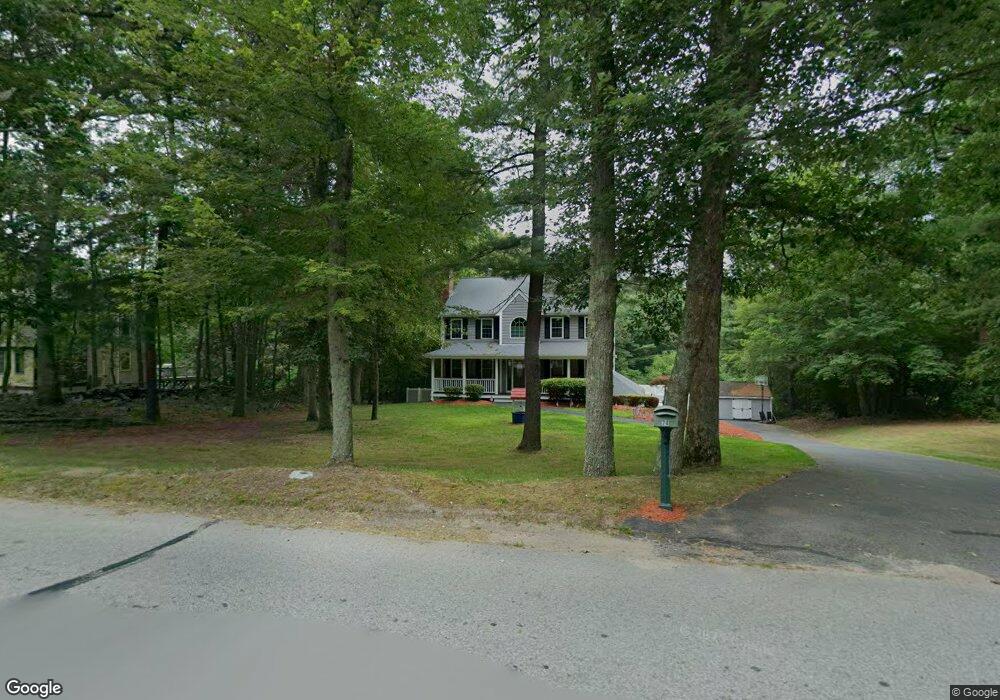
74 Bryant St Berkley, MA 02779
Berkley Bridge/Lower Berkley NeighborhoodEstimated Value: $584,000 - $702,265
3
Beds
3
Baths
2,016
Sq Ft
$330/Sq Ft
Est. Value
About This Home
This home is located at 74 Bryant St, Berkley, MA 02779 and is currently estimated at $664,316, approximately $329 per square foot. 74 Bryant St is a home located in Bristol County with nearby schools including Berkley Community School.
Ownership History
Date
Name
Owned For
Owner Type
Purchase Details
Closed on
Oct 2, 2007
Sold by
Thomas Lana and Thomas Stephen
Bought by
Thomas Lana and Thomas Stephen
Current Estimated Value
Home Financials for this Owner
Home Financials are based on the most recent Mortgage that was taken out on this home.
Original Mortgage
$346,000
Outstanding Balance
$220,957
Interest Rate
6.65%
Mortgage Type
Purchase Money Mortgage
Estimated Equity
$443,359
Purchase Details
Closed on
Dec 5, 2003
Sold by
Donway Rt and Cunha Donna
Bought by
Thomas Stephen and Thomas Lana
Home Financials for this Owner
Home Financials are based on the most recent Mortgage that was taken out on this home.
Original Mortgage
$317,000
Interest Rate
6.03%
Mortgage Type
Purchase Money Mortgage
Purchase Details
Closed on
Feb 25, 2002
Sold by
Haworth Myrtle L
Bought by
Donway Rt and Cunha Donna
Purchase Details
Closed on
Oct 17, 2001
Sold by
Hoffman Ann S
Bought by
Haworth Myrtle L
Create a Home Valuation Report for This Property
The Home Valuation Report is an in-depth analysis detailing your home's value as well as a comparison with similar homes in the area
Home Values in the Area
Average Home Value in this Area
Purchase History
| Date | Buyer | Sale Price | Title Company |
|---|---|---|---|
| Thomas Lana | -- | -- | |
| Thomas Stephen | $396,400 | -- | |
| Donway Rt | $80,000 | -- | |
| Haworth Myrtle L | $50,000 | -- |
Source: Public Records
Mortgage History
| Date | Status | Borrower | Loan Amount |
|---|---|---|---|
| Open | Thomas Lana | $346,000 | |
| Previous Owner | Thomas Stephen | $317,000 |
Source: Public Records
Tax History Compared to Growth
Tax History
| Year | Tax Paid | Tax Assessment Tax Assessment Total Assessment is a certain percentage of the fair market value that is determined by local assessors to be the total taxable value of land and additions on the property. | Land | Improvement |
|---|---|---|---|---|
| 2025 | $76 | $630,000 | $145,000 | $485,000 |
| 2024 | $7,355 | $590,800 | $124,900 | $465,900 |
| 2023 | $6,952 | $525,900 | $124,900 | $401,000 |
| 2022 | $6,816 | $495,700 | $108,600 | $387,100 |
| 2021 | $6,612 | $463,000 | $103,400 | $359,600 |
| 2020 | $6,492 | $446,800 | $91,500 | $355,300 |
| 2019 | $6,226 | $425,300 | $91,500 | $333,800 |
| 2018 | $5,692 | $406,000 | $88,000 | $318,000 |
| 2017 | $5,361 | $374,900 | $98,600 | $276,300 |
| 2016 | $5,132 | $345,800 | $98,600 | $247,200 |
| 2015 | $4,813 | $346,000 | $98,600 | $247,400 |
| 2014 | $4,573 | $357,000 | $107,000 | $250,000 |
Source: Public Records
Map
Nearby Homes