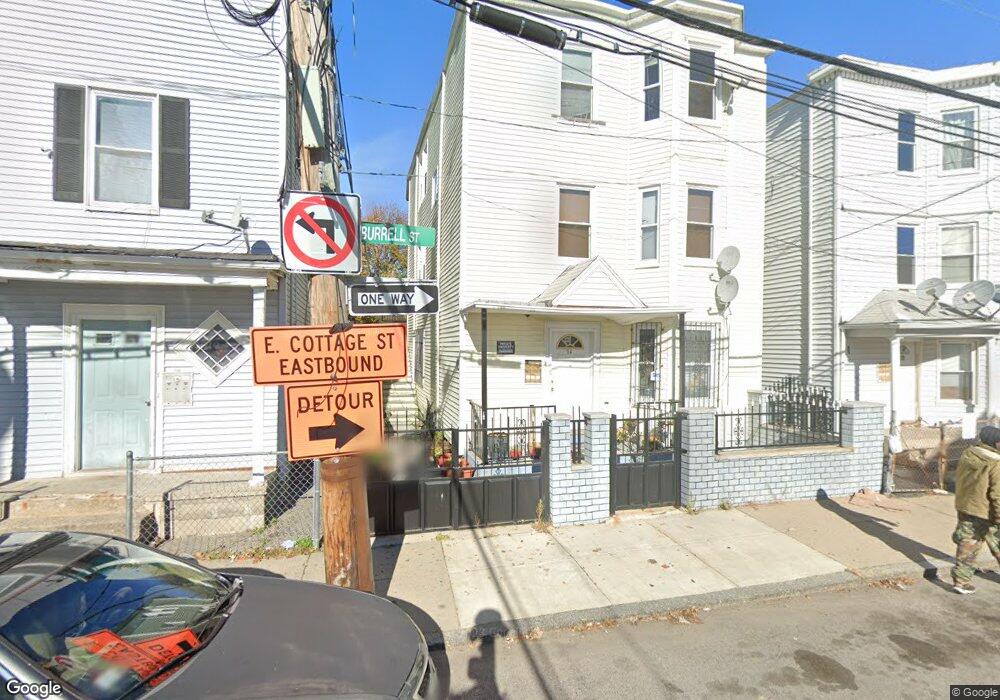
74 Burrell St Roxbury, MA 02119
Dudley-Brunswick King NeighborhoodEstimated Value: $463,000 - $1,117,000
6
Beds
3
Baths
2,439
Sq Ft
$354/Sq Ft
Est. Value
About This Home
This home is located at 74 Burrell St, Roxbury, MA 02119 and is currently estimated at $862,667, approximately $353 per square foot. 74 Burrell St is a home located in Suffolk County with nearby schools including Dudley Street Neighborhood Charter School, Boston Collegiate Charter School, and Pope John Paul II Catholic Academy Columbia Campus.
Ownership History
Date
Name
Owned For
Owner Type
Purchase Details
Closed on
Jan 25, 2007
Sold by
Us Bk
Bought by
Riberio Maria and Riberio Sergio
Current Estimated Value
Home Financials for this Owner
Home Financials are based on the most recent Mortgage that was taken out on this home.
Original Mortgage
$68,000
Outstanding Balance
$40,706
Interest Rate
6.15%
Mortgage Type
Purchase Money Mortgage
Estimated Equity
$821,961
Purchase Details
Closed on
Nov 2, 2006
Sold by
Barbosa Irlando and Mers
Bought by
Deutsche Bank Natl T C
Purchase Details
Closed on
Apr 19, 2005
Sold by
Barbosa Alvaro and Barbosa Diolinda
Bought by
Barbosa Irlando
Home Financials for this Owner
Home Financials are based on the most recent Mortgage that was taken out on this home.
Original Mortgage
$392,000
Interest Rate
5.78%
Mortgage Type
Purchase Money Mortgage
Create a Home Valuation Report for This Property
The Home Valuation Report is an in-depth analysis detailing your home's value as well as a comparison with similar homes in the area
Home Values in the Area
Average Home Value in this Area
Purchase History
| Date | Buyer | Sale Price | Title Company |
|---|---|---|---|
| Riberio Maria | $340,000 | -- | |
| Us Bk | -- | -- | |
| Deutsche Bank Natl T C | $378,000 | -- | |
| Barbosa Irlando | -- | -- |
Source: Public Records
Mortgage History
| Date | Status | Borrower | Loan Amount |
|---|---|---|---|
| Open | Us Bk | $68,000 | |
| Open | Riberio Maria | $261,800 | |
| Previous Owner | Barbosa Irlando | $392,000 | |
| Previous Owner | Barbosa Irlando | $73,500 |
Source: Public Records
Tax History
| Year | Tax Paid | Tax Assessment Tax Assessment Total Assessment is a certain percentage of the fair market value that is determined by local assessors to be the total taxable value of land and additions on the property. | Land | Improvement |
|---|---|---|---|---|
| 2025 | $8,961 | $773,800 | $219,400 | $554,400 |
| 2024 | $7,338 | $673,200 | $184,100 | $489,100 |
| 2023 | $6,457 | $601,200 | $164,400 | $436,800 |
| 2022 | $6,351 | $583,700 | $159,600 | $424,100 |
| 2021 | $5,822 | $545,600 | $149,200 | $396,400 |
| 2020 | $4,632 | $438,600 | $166,700 | $271,900 |
| 2019 | $4,019 | $381,300 | $104,200 | $277,100 |
| 2018 | $3,568 | $340,500 | $104,200 | $236,300 |
| 2017 | $3,339 | $315,300 | $104,200 | $211,100 |
| 2016 | $3,015 | $274,100 | $104,200 | $169,900 |
| 2015 | $2,885 | $238,200 | $84,200 | $154,000 |
| 2014 | $2,908 | $231,200 | $84,200 | $147,000 |
Source: Public Records
Map
Nearby Homes
- 66 Burrell St
- 69 Burrell St
- 14 Robey St Unit 14
- 18 Albion St Unit 2
- 23 E Cottage St
- 9 Batchelder St Unit 1
- 102-104 Robey St
- 24 Clarence St Unit 24R
- 25 Hillsboro St Unit 1
- 1-3 Howard Place Unit B
- 85 Willow Ct Unit PH501
- 127 E Cottage St Unit 6
- 76 Belden St
- 47 W Cottage St Unit 1
- 26 Elder St Unit 2
- 706-714 Dudley St
- 23 Woodward Park St
- 10 Wendover St
- 80 Blue Hill Ave Unit 5
- 8 Elder St
- 78 Burrell St
- 72 Burrell St Unit 72A
- 80 Burrell St
- 70 Burrell St Unit 70A
- 66 Burrell St
- 66 Burrell St Unit 3
- 66 Burrell St Unit 1
- 75 Burrell St Unit 1
- 65 Batchelder St
- 75 Burrell St
- 65 Batchelder St Unit 65
- 65 Batchelder St Unit 1
- 75 Burrell St
- 75 Burrell St Unit 3
- 69 Burrell St Unit 3
- 67 Burrell St
- 67 Burrell St Unit 3
- 67 Burrell St
- 77 Burrell St
- 79 Burrell St
Your Personal Tour Guide
Ask me questions while you tour the home.