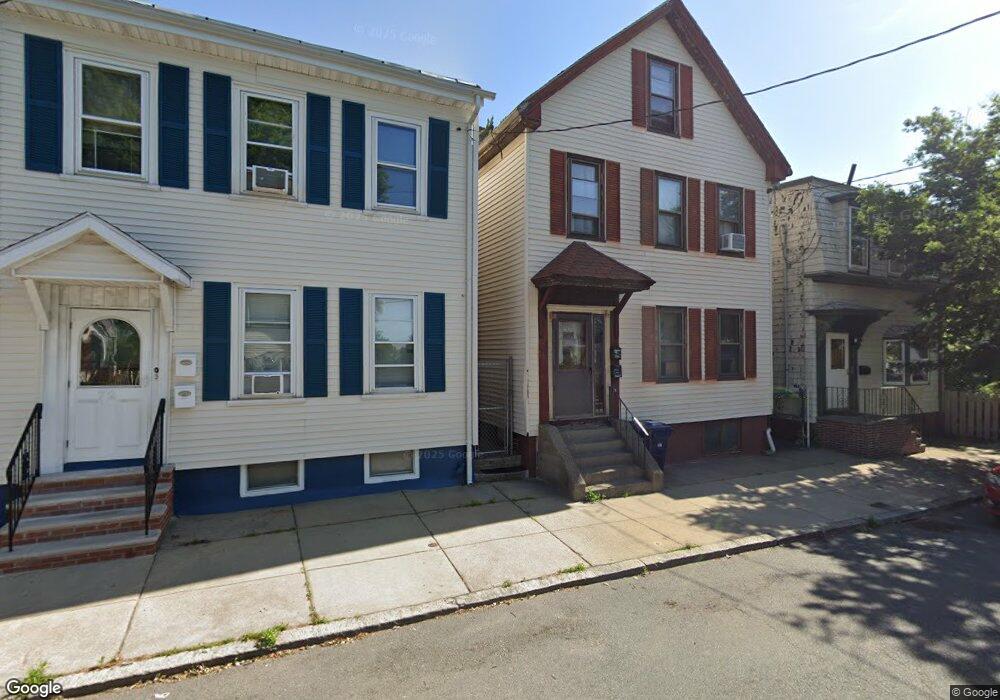
74 Byron St Unit 5 Boston, MA 02128
Harbor View-Orient Heights NeighborhoodEstimated Value: $379,000 - $410,161
2
Beds
1
Bath
780
Sq Ft
$504/Sq Ft
Est. Value
About This Home
This home is located at 74 Byron St Unit 5, Boston, MA 02128 and is currently estimated at $393,040, approximately $503 per square foot. 74 Byron St Unit 5 is a home located in Suffolk County with nearby schools including Excel Academy East Boston, Brooke Charter Schools East Boston, and East Boston Montessori School.
Ownership History
Date
Name
Owned For
Owner Type
Purchase Details
Closed on
Feb 3, 2015
Sold by
Yungman George G
Bought by
Yungman George G and Yungman Katie V
Current Estimated Value
Purchase Details
Closed on
Jun 25, 2010
Sold by
Chestnut Village Condo
Bought by
Yungman George C and Yungman George G
Home Financials for this Owner
Home Financials are based on the most recent Mortgage that was taken out on this home.
Original Mortgage
$141,200
Interest Rate
4.98%
Mortgage Type
Purchase Money Mortgage
Purchase Details
Closed on
Sep 7, 2001
Sold by
Eyal Armos
Bought by
Turner Marcella
Home Financials for this Owner
Home Financials are based on the most recent Mortgage that was taken out on this home.
Original Mortgage
$152,100
Interest Rate
7.05%
Mortgage Type
Purchase Money Mortgage
Purchase Details
Closed on
Jun 3, 1999
Sold by
Waldman Dennis K
Bought by
Eyal Armos
Home Financials for this Owner
Home Financials are based on the most recent Mortgage that was taken out on this home.
Original Mortgage
$72,100
Interest Rate
6.85%
Mortgage Type
Purchase Money Mortgage
Create a Home Valuation Report for This Property
The Home Valuation Report is an in-depth analysis detailing your home's value as well as a comparison with similar homes in the area
Home Values in the Area
Average Home Value in this Area
Purchase History
| Date | Buyer | Sale Price | Title Company |
|---|---|---|---|
| Yungman George G | -- | -- | |
| Yungman George C | $176,500 | -- | |
| Turner Marcella | $169,000 | -- | |
| Eyal Armos | $103,000 | -- |
Source: Public Records
Mortgage History
| Date | Status | Borrower | Loan Amount |
|---|---|---|---|
| Previous Owner | Yungman George C | $141,200 | |
| Previous Owner | Eyal Armos | $152,100 | |
| Previous Owner | Eyal Armos | $72,100 |
Source: Public Records
Tax History
| Year | Tax Paid | Tax Assessment Tax Assessment Total Assessment is a certain percentage of the fair market value that is determined by local assessors to be the total taxable value of land and additions on the property. | Land | Improvement |
|---|---|---|---|---|
| 2025 | $4,440 | $383,400 | $0 | $383,400 |
| 2024 | $3,874 | $355,400 | $0 | $355,400 |
| 2023 | $3,703 | $344,800 | $0 | $344,800 |
| 2022 | $3,573 | $328,400 | $0 | $328,400 |
| 2021 | $3,504 | $328,400 | $0 | $328,400 |
| 2020 | $2,700 | $255,700 | $0 | $255,700 |
| 2019 | $2,518 | $238,900 | $0 | $238,900 |
| 2018 | $2,276 | $217,200 | $0 | $217,200 |
| 2017 | $2,211 | $208,800 | $0 | $208,800 |
| 2016 | $2,147 | $195,200 | $0 | $195,200 |
| 2015 | $2,331 | $192,500 | $0 | $192,500 |
| 2014 | -- | $176,600 | $0 | $176,600 |
Source: Public Records
Map
Nearby Homes
- 10 Wordsworth St
- 58 Byron St Unit 3
- 31 Wordsworth St
- 95 Addison St Unit 206
- 95 Addison St Unit 102
- 95 Addison St Unit PH10
- 43 Wordsworth St Unit 2
- 125 Addison St Unit 309
- 125 Addison St Unit 206
- 795 Saratoga St
- 655 Saratoga St Unit 201
- 512 Bennington St
- 622-624 Saratoga St
- 873 Saratoga St
- 198 Byron St
- 130 Coleridge St Unit 6
- 130 Coleridge St Unit 1
- 136 Coleridge St
- 165 Cottage St Unit 413
- 165 Cottage St Unit 706
- 74 Byron St Unit 6
- 74 Byron St Unit 4
- 74 Byron St Unit 3
- 74 Byron St Unit 2
- 74 Byron St Unit 1
- 74 Byron St
- 72 Byron St Unit 6
- 72 Byron St Unit 5
- 72 Byron St Unit 4
- 72 Byron St Unit 3
- 72 Byron St Unit 2
- 72 Byron St Unit 1
- 72 Byron St
- 72 Byron St Unit 4
- 76 Byron St Unit 6
- 76 Byron St Unit 5
- 76 Byron St Unit 4
- 76 Byron St Unit 3
- 76 Byron St Unit 2
- 76 Byron St Unit 1
Your Personal Tour Guide
Ask me questions while you tour the home.