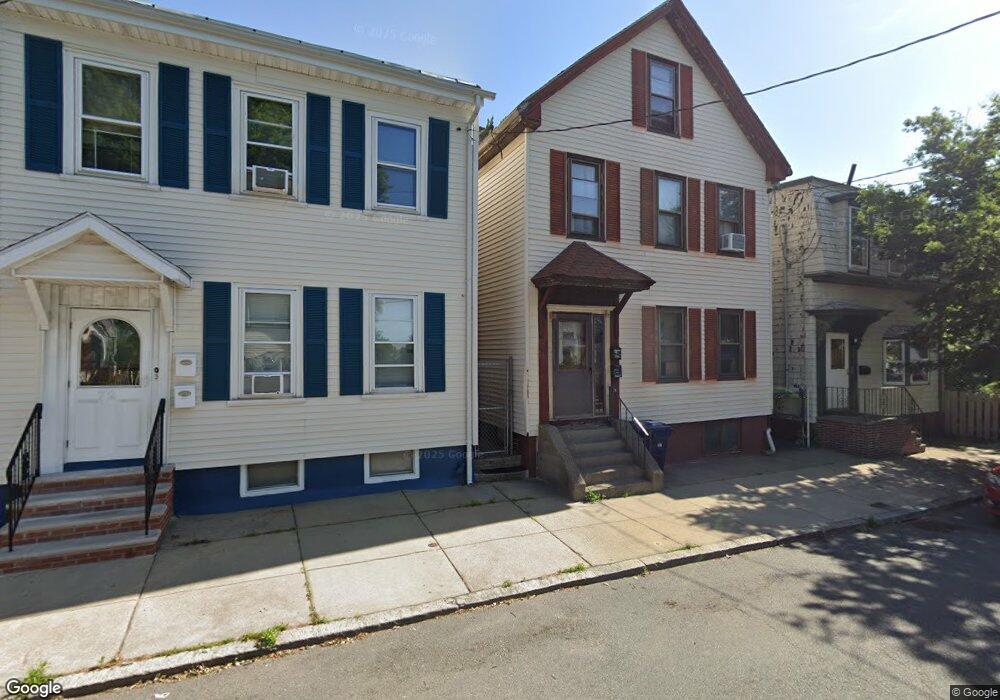
74 Byron St Boston, MA 02128
Harbor View-Orient Heights NeighborhoodEstimated Value: $819,013 - $876,000
2
Beds
3
Baths
2,179
Sq Ft
$389/Sq Ft
Est. Value
About This Home
This home is located at 74 Byron St, Boston, MA 02128 and is currently estimated at $847,503, approximately $388 per square foot. 74 Byron St is a home located in Suffolk County with nearby schools including Excel Academy East Boston, Brooke Charter Schools East Boston, and East Boston Montessori School.
Ownership History
Date
Name
Owned For
Owner Type
Purchase Details
Closed on
Jan 28, 2019
Sold by
Homsy Farhat N and Homsy Khatoum F
Bought by
Fandr Realty Llc
Current Estimated Value
Purchase Details
Closed on
Mar 7, 2013
Sold by
Mcalean Lorraine
Bought by
Dileo Lorraine
Home Financials for this Owner
Home Financials are based on the most recent Mortgage that was taken out on this home.
Original Mortgage
$216,750
Interest Rate
3.75%
Mortgage Type
FHA
Purchase Details
Closed on
Aug 25, 1999
Sold by
Mcintyre Daniel P
Bought by
Maclean Eileen M and Maclean Lorraine
Home Financials for this Owner
Home Financials are based on the most recent Mortgage that was taken out on this home.
Original Mortgage
$65,000
Interest Rate
7.53%
Mortgage Type
Purchase Money Mortgage
Purchase Details
Closed on
Sep 19, 1988
Sold by
Chestnut Rt
Bought by
Kozakiewicz Victor
Create a Home Valuation Report for This Property
The Home Valuation Report is an in-depth analysis detailing your home's value as well as a comparison with similar homes in the area
Home Values in the Area
Average Home Value in this Area
Purchase History
| Date | Buyer | Sale Price | Title Company |
|---|---|---|---|
| Fandr Realty Llc | $250,000 | -- | |
| Dileo Lorraine | -- | -- | |
| Maclean Eileen M | $55,000 | -- | |
| Kozakiewicz Victor | $105,000 | -- |
Source: Public Records
Mortgage History
| Date | Status | Borrower | Loan Amount |
|---|---|---|---|
| Previous Owner | Dileo Lorraine | $216,750 | |
| Previous Owner | Kozakiewicz Victor | $175,000 | |
| Previous Owner | Kozakiewicz Victor | $24,262 | |
| Previous Owner | Kozakiewicz Victor | $65,000 |
Source: Public Records
Tax History Compared to Growth
Tax History
| Year | Tax Paid | Tax Assessment Tax Assessment Total Assessment is a certain percentage of the fair market value that is determined by local assessors to be the total taxable value of land and additions on the property. | Land | Improvement |
|---|---|---|---|---|
| 2025 | $7,898 | $682,000 | $241,100 | $440,900 |
| 2024 | $7,271 | $667,100 | $199,500 | $467,600 |
| 2023 | $6,825 | $635,500 | $190,100 | $445,400 |
| 2022 | $6,459 | $593,700 | $177,600 | $416,100 |
| 2021 | $6,033 | $565,400 | $169,100 | $396,300 |
| 2020 | $5,341 | $505,800 | $164,700 | $341,100 |
| 2019 | $4,837 | $458,900 | $115,800 | $343,100 |
| 2018 | $4,372 | $417,200 | $115,800 | $301,400 |
| 2017 | $4,017 | $379,300 | $115,800 | $263,500 |
| 2016 | $3,793 | $344,800 | $115,800 | $229,000 |
| 2015 | $3,572 | $295,000 | $99,200 | $195,800 |
| 2014 | $3,125 | $248,400 | $99,200 | $149,200 |
Source: Public Records
Map
Nearby Homes
- 31 Wordsworth St
- 7 Wordsworth St Unit 1-101
- 10 Wordsworth St
- 95 Addison St Unit 206
- 95 Addison St Unit A
- 580 Bennington St Unit 580
- 125 Addison St Unit 309
- 125 Addison St Unit 207
- 125 Addison St Unit 8
- 125 Addison St Unit 6
- 795 Saratoga St
- 528 Bennington St
- 655 Saratoga St Unit 201
- 443 Bennington St
- 512 Bennington St
- 106 Moore St Unit PH6
- 106 Moore St Unit PH7
- 106 Moore St Unit 8
- 177 Cowper St
- 165 Cottage St Unit 611
- 74 Byron St Unit 6
- 74 Byron St Unit 5
- 74 Byron St Unit 4
- 74 Byron St Unit 3
- 74 Byron St Unit 2
- 74 Byron St Unit 1
- 72 Byron St Unit 6
- 72 Byron St Unit 5
- 72 Byron St Unit 4
- 72 Byron St Unit 3
- 72 Byron St Unit 2
- 72 Byron St Unit 1
- 72 Byron St
- 72 Byron St Unit 4
- 76 Byron St Unit 6
- 76 Byron St Unit 5
- 76 Byron St Unit 4
- 76 Byron St Unit 3
- 76 Byron St Unit 2
- 76 Byron St Unit 1