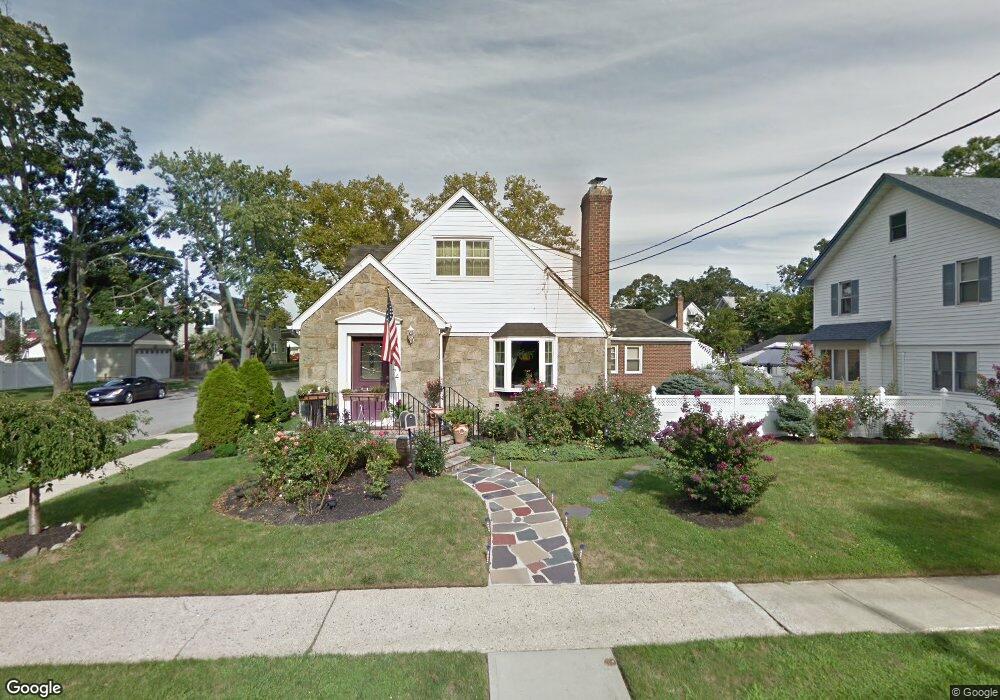
74 Chestnut St Lynbrook, NY 11563
Estimated Value: $842,000 - $849,018
Studio
3
Baths
1,927
Sq Ft
$439/Sq Ft
Est. Value
About This Home
This home is located at 74 Chestnut St, Lynbrook, NY 11563 and is currently estimated at $845,509, approximately $438 per square foot. 74 Chestnut St is a home located in Nassau County with nearby schools including Davison Avenue Intermediate School, Maurice W. Downing Primary K-2 School, and Howard T Herber Middle School.
Ownership History
Date
Name
Owned For
Owner Type
Purchase Details
Closed on
Aug 6, 2015
Sold by
Lasso Andres and Rodriguez Luis F
Bought by
Lasso Andres
Current Estimated Value
Home Financials for this Owner
Home Financials are based on the most recent Mortgage that was taken out on this home.
Original Mortgage
$369,000
Outstanding Balance
$290,611
Interest Rate
4.07%
Mortgage Type
Purchase Money Mortgage
Estimated Equity
$554,898
Purchase Details
Closed on
Sep 30, 2010
Sold by
Massa Joseph and Roseann-Chisthti Iman
Bought by
Lasso Andres and Rodriguez Luis F
Home Financials for this Owner
Home Financials are based on the most recent Mortgage that was taken out on this home.
Original Mortgage
$384,306
Interest Rate
3.25%
Mortgage Type
FHA
Purchase Details
Closed on
Sep 10, 2009
Sold by
Massa Joseph R and Massa Samuel
Bought by
Massa Joseph R and Chisti Iman Roseann
Create a Home Valuation Report for This Property
The Home Valuation Report is an in-depth analysis detailing your home's value as well as a comparison with similar homes in the area
Home Values in the Area
Average Home Value in this Area
Purchase History
| Date | Buyer | Sale Price | Title Company |
|---|---|---|---|
| Lasso Andres | -- | First Choice Settlement Llc | |
| Lasso Andres | $390,000 | -- | |
| Massa Joseph R | -- | -- |
Source: Public Records
Mortgage History
| Date | Status | Borrower | Loan Amount |
|---|---|---|---|
| Open | Lasso Andres | $369,000 | |
| Closed | Lasso Andres | $384,306 |
Source: Public Records
Tax History
| Year | Tax Paid | Tax Assessment Tax Assessment Total Assessment is a certain percentage of the fair market value that is determined by local assessors to be the total taxable value of land and additions on the property. | Land | Improvement |
|---|---|---|---|---|
| 2025 | $12,588 | $578 | $230 | $348 |
| 2024 | $1,289 | $578 | $230 | $348 |
Source: Public Records
Map
Nearby Homes
- 58 Chestnut St
- 367 Vincent Ave
- 25 Centre St
- 42 Driving Park Ave
- 137 Charles St
- 157 Hempstead Ave Unit B20
- 45 Lynbrook Ave
- 266 Earle Ave
- 212 Lakeview Ave
- 63 Central Ave
- 90 Pearsall Ave
- 30 York St
- 21 Washington Ave
- 17 Oxford St
- 60 Hempstead Ave Unit 1K
- 60 Hempstead Ave Unit 1J
- 75 Noble St Unit 126
- 75 Noble St Unit 121
- 64 Hodson Ave
- 40 Hendrickson Ave
- 74 Chestnut St Unit Rear
- 70 Chestnut St
- 1 Lawrence Ave Unit A
- 1A Lawrence Ave
- 85 Rolling St
- 88 Chestnut St
- 62 Chestnut St
- 83 Rolling St
- 83 Rolling St Unit A
- 83A Rolling St
- 63 Chestnut St
- 67 Chestnut St
- 61 Chestnut St
- 81 Rolling St
- 81 Rolling St Unit Lower
- 91 Rolling St
- 73 Chestnut St
- 90 Chestnut St
- 57 Chestnut St
- 79 Rolling St
Your Personal Tour Guide
Ask me questions while you tour the home.