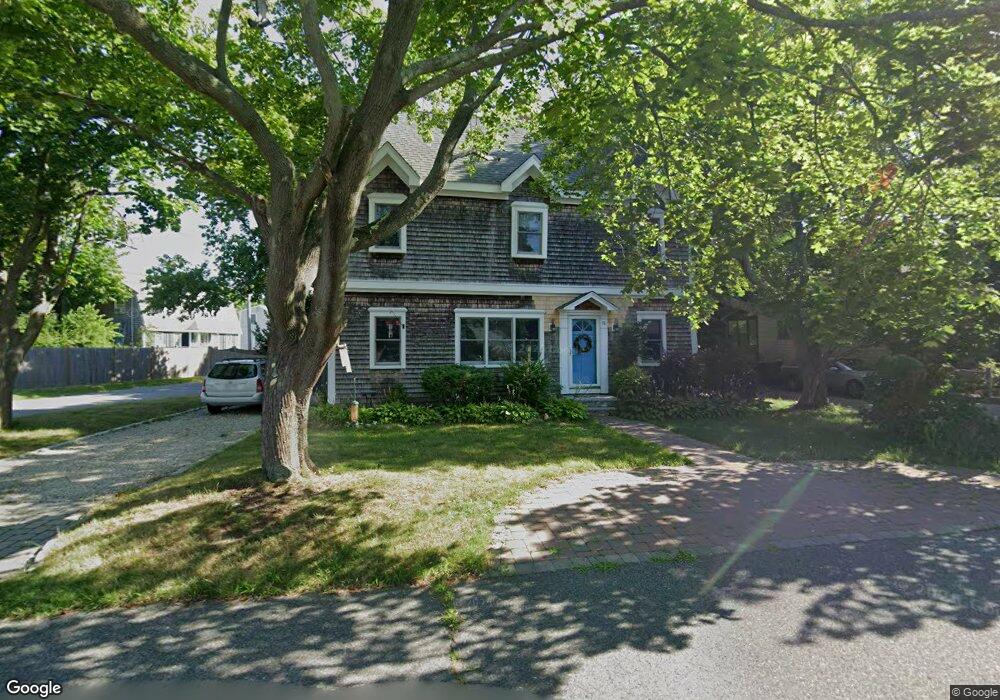
74 Colonial Rd Marshfield, MA 02050
Ocean Bluff-Brant Rock NeighborhoodEstimated Value: $577,000 - $922,000
4
Beds
2
Baths
2,158
Sq Ft
$373/Sq Ft
Est. Value
About This Home
This home is located at 74 Colonial Rd, Marshfield, MA 02050 and is currently estimated at $803,883, approximately $372 per square foot. 74 Colonial Rd is a home located in Plymouth County with nearby schools including Governor Edward Winslow School, Furnace Brook Middle School, and Marshfield High School.
Ownership History
Date
Name
Owned For
Owner Type
Purchase Details
Closed on
Aug 25, 2025
Sold by
Waldron-Fultz Deborah and Fultz Robert L
Bought by
Fultz Ft and Waldron-Fultz
Current Estimated Value
Purchase Details
Closed on
Apr 26, 1991
Sold by
Carcio Frank A and Carcio Helen A
Bought by
Fultz Robert L and Fultz Deborah W
Purchase Details
Closed on
Mar 22, 1988
Sold by
Taylor-Steiner C
Bought by
Carcio Frank A
Create a Home Valuation Report for This Property
The Home Valuation Report is an in-depth analysis detailing your home's value as well as a comparison with similar homes in the area
Home Values in the Area
Average Home Value in this Area
Purchase History
| Date | Buyer | Sale Price | Title Company |
|---|---|---|---|
| Fultz Ft | -- | -- | |
| Fultz Ft | -- | -- | |
| Fultz Robert L | $111,000 | -- | |
| Fultz Robert L | $111,000 | -- | |
| Carcio Frank A | $110,000 | -- |
Source: Public Records
Mortgage History
| Date | Status | Borrower | Loan Amount |
|---|---|---|---|
| Previous Owner | Carcio Frank A | $100,000 | |
| Previous Owner | Carcio Frank A | $138,231 |
Source: Public Records
Tax History
| Year | Tax Paid | Tax Assessment Tax Assessment Total Assessment is a certain percentage of the fair market value that is determined by local assessors to be the total taxable value of land and additions on the property. | Land | Improvement |
|---|---|---|---|---|
| 2025 | $6,362 | $642,600 | $317,800 | $324,800 |
| 2024 | $5,648 | $543,600 | $298,000 | $245,600 |
| 2023 | $5,300 | $481,600 | $268,200 | $213,400 |
| 2022 | $5,300 | $409,300 | $228,400 | $180,900 |
| 2021 | $5,032 | $381,500 | $218,500 | $163,000 |
| 2020 | $4,628 | $347,200 | $188,700 | $158,500 |
| 2019 | $4,526 | $338,300 | $188,700 | $149,600 |
| 2018 | $4,483 | $335,300 | $188,700 | $146,600 |
| 2017 | $4,293 | $312,900 | $178,800 | $134,100 |
| 2016 | $4,079 | $293,900 | $168,800 | $125,100 |
| 2015 | $3,866 | $290,900 | $168,800 | $122,100 |
| 2014 | $3,789 | $285,100 | $168,800 | $116,300 |
Source: Public Records
Map
Nearby Homes
- 78 Tower Ave
- 122 June St
- 256 Ocean St
- 19 2nd Rd
- 106 Careswell St
- 32 Gratto Rd
- 38 Winthrop Dr
- 71 Gurnet Rd
- 30 Chandler Dr
- 116 Outlook Rd
- 42 Carr Rd
- 86 Barouche Dr
- 713 Webster St
- 1801 Ocean St Unit B31
- 92 Salt Meadow Waye
- 184 King Phillips Pathe
- 431 Moraine St
- 255 Ridge Rd
- 242 Enterprise St
- 39 High Beacon Way