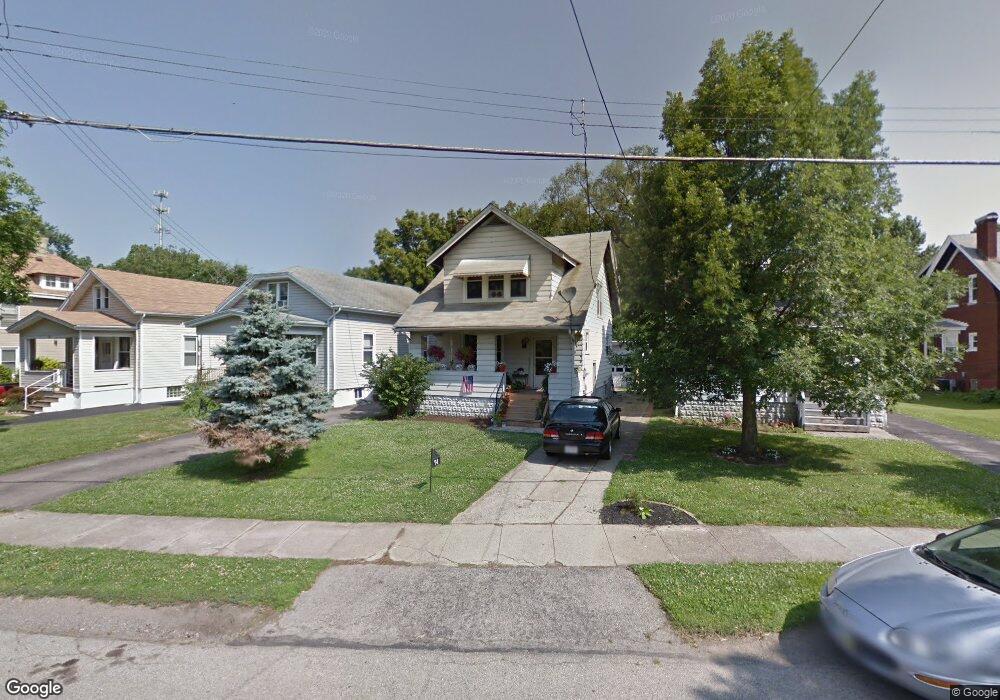
74 De Camp Ave Cincinnati, OH 45216
Hartwell NeighborhoodEstimated Value: $121,000 - $184,000
3
Beds
1
Bath
1,518
Sq Ft
$108/Sq Ft
Est. Value
About This Home
This home is located at 74 De Camp Ave, Cincinnati, OH 45216 and is currently estimated at $163,909, approximately $107 per square foot. 74 De Camp Ave is a home located in Hamilton County with nearby schools including Rising Stars at Carthage, Hartwell School, and Shroder High School.
Ownership History
Date
Name
Owned For
Owner Type
Purchase Details
Closed on
Feb 23, 2009
Sold by
Hsbc Bank Usa National Association
Bought by
Hart Kelly L
Current Estimated Value
Home Financials for this Owner
Home Financials are based on the most recent Mortgage that was taken out on this home.
Original Mortgage
$48,450
Outstanding Balance
$30,423
Interest Rate
5.22%
Mortgage Type
New Conventional
Estimated Equity
$133,486
Purchase Details
Closed on
Sep 10, 2008
Sold by
Kreitzer Steven E
Bought by
Hsbc Bank Usa National Association
Purchase Details
Closed on
May 22, 2003
Sold by
Hibbard James A
Bought by
Kreitzer Steven E
Purchase Details
Closed on
Apr 6, 1995
Sold by
Smith Leroy Willis
Bought by
Hibbard James A and Kreitzer Steven E
Home Financials for this Owner
Home Financials are based on the most recent Mortgage that was taken out on this home.
Original Mortgage
$65,440
Interest Rate
8.55%
Mortgage Type
FHA
Create a Home Valuation Report for This Property
The Home Valuation Report is an in-depth analysis detailing your home's value as well as a comparison with similar homes in the area
Home Values in the Area
Average Home Value in this Area
Purchase History
| Date | Buyer | Sale Price | Title Company |
|---|---|---|---|
| Hart Kelly L | $51,000 | Attorney | |
| Hsbc Bank Usa National Association | $66,000 | None Available | |
| Kreitzer Steven E | $111,900 | -- | |
| Hibbard James A | -- | -- |
Source: Public Records
Mortgage History
| Date | Status | Borrower | Loan Amount |
|---|---|---|---|
| Open | Hart Kelly L | $48,450 | |
| Previous Owner | Hibbard James A | $65,440 |
Source: Public Records
Tax History
| Year | Tax Paid | Tax Assessment Tax Assessment Total Assessment is a certain percentage of the fair market value that is determined by local assessors to be the total taxable value of land and additions on the property. | Land | Improvement |
|---|---|---|---|---|
| 2025 | $2,011 | $32,516 | $5,695 | $26,821 |
| 2024 | $1,953 | $32,516 | $5,695 | $26,821 |
| 2023 | $1,995 | $32,516 | $5,695 | $26,821 |
| 2022 | $1,147 | $16,703 | $5,373 | $11,330 |
| 2021 | $1,103 | $16,703 | $5,373 | $11,330 |
| 2020 | $1,133 | $16,703 | $5,373 | $11,330 |
| 2019 | $1,148 | $15,464 | $4,974 | $10,490 |
| 2018 | $1,150 | $15,464 | $4,974 | $10,490 |
| 2017 | $1,092 | $15,464 | $4,974 | $10,490 |
| 2016 | $1,214 | $16,958 | $4,974 | $11,984 |
| 2015 | $1,095 | $16,958 | $4,974 | $11,984 |
| 2014 | $1,102 | $16,958 | $4,974 | $11,984 |
| 2013 | $1,180 | $17,850 | $5,236 | $12,614 |
Source: Public Records
Map
Nearby Homes
- 8081 Woodbine Ave
- 241 Oakmont St
- 29 Hartwell Ct
- 1501 Summit Rd
- 1511 Summit Rd
- 8318 Marley St
- 42 Sheehan Ave
- 8338 Anthony Wayne Ave
- 7871 Glenorchard Dr
- 7831 Glen Orchard Dr
- 8421 Wiswell St
- 118 W North Bend Rd
- 1519 Section Rd
- 8415 Mayfair St
- 3 W 73rd St
- 7505 Greenland Place
- 7829 Sunfield Dr
- 25 Euclid Ave
- 120 W Seventy Second St
- 1808 Crest Hill Ave
- 70 De Camp Ave
- 68 De Camp Ave
- 86 De Camp Ave
- 66 De Camp Ave
- 88 De Camp Ave
- 64 De Camp Ave
- 94 De Camp Ave
- 139 Wildwood St
- 143 Wildwood St
- 60 De Camp Ave
- 8131 Woodbine Ave
- 67 De Camp Ave
- 149 Wildwood St
- 56 De Camp Ave
- 8133 Woodbine Ave
- 63 De Camp Ave
- 129 Wildwood St
- 153 Wildwood St
- 55 De Camp Ave
- 52 De Camp Ave
Your Personal Tour Guide
Ask me questions while you tour the home.