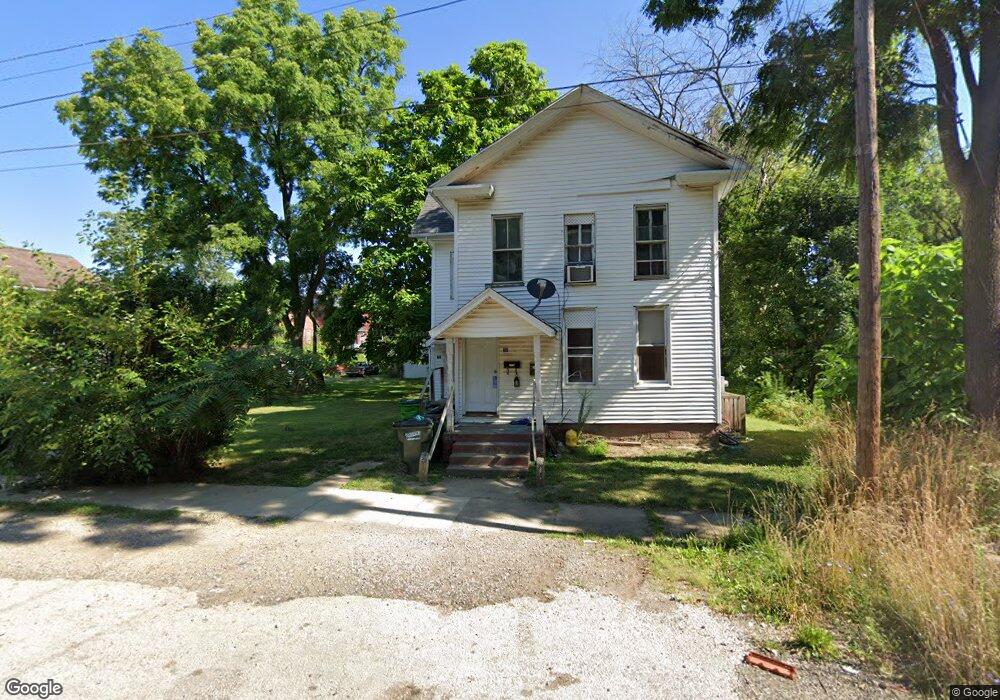
74 E Cambridge St Alliance, OH 44601
Estimated Value: $44,000 - $88,000
4
Beds
2
Baths
1,808
Sq Ft
$37/Sq Ft
Est. Value
About This Home
This home is located at 74 E Cambridge St, Alliance, OH 44601 and is currently estimated at $66,855, approximately $36 per square foot. 74 E Cambridge St is a home located in Stark County with nearby schools including Alliance Intermediate School at Northside, Alliance Elementary School at Rockhill, and Alliance Middle School.
Ownership History
Date
Name
Owned For
Owner Type
Purchase Details
Closed on
Dec 14, 2023
Sold by
Bellelower Estates Llc
Bought by
Mra Properties Llc
Current Estimated Value
Purchase Details
Closed on
Dec 11, 2023
Sold by
Rickerman Jeffrey
Bought by
Belleflower Estates Llc
Purchase Details
Closed on
Dec 2, 2013
Sold by
Deleon Sofia S and Deleon Sofia
Bought by
Rickerman Jeffrey
Purchase Details
Closed on
Apr 9, 2001
Sold by
Deleon Francisco G and Deleon Sofia
Bought by
Deleon Francisco G and Deleon Sofia
Home Financials for this Owner
Home Financials are based on the most recent Mortgage that was taken out on this home.
Original Mortgage
$42,400
Interest Rate
7.05%
Mortgage Type
Purchase Money Mortgage
Purchase Details
Closed on
Aug 15, 1997
Sold by
Everett Charlie
Bought by
Deleon Francisco G
Create a Home Valuation Report for This Property
The Home Valuation Report is an in-depth analysis detailing your home's value as well as a comparison with similar homes in the area
Home Values in the Area
Average Home Value in this Area
Purchase History
| Date | Buyer | Sale Price | Title Company |
|---|---|---|---|
| Mra Properties Llc | $39,000 | None Listed On Document | |
| Belleflower Estates Llc | -- | None Listed On Document | |
| Rickerman Jeffrey | $12,000 | Sebring Title Agency Inc | |
| Deleon Francisco G | -- | -- | |
| Deleon Francisco G | $10,000 | -- |
Source: Public Records
Mortgage History
| Date | Status | Borrower | Loan Amount |
|---|---|---|---|
| Previous Owner | Deleon Francisco G | $42,400 |
Source: Public Records
Tax History
| Year | Tax Paid | Tax Assessment Tax Assessment Total Assessment is a certain percentage of the fair market value that is determined by local assessors to be the total taxable value of land and additions on the property. | Land | Improvement |
|---|---|---|---|---|
| 2025 | $307 | $15,820 | $3,920 | $11,900 |
| 2024 | -- | $15,820 | $3,920 | $11,900 |
| 2023 | $671 | $15,900 | $2,140 | $13,760 |
| 2022 | $659 | $15,900 | $2,140 | $13,760 |
| 2021 | $661 | $15,900 | $2,140 | $13,760 |
| 2020 | $596 | $13,410 | $1,860 | $11,550 |
| 2019 | $588 | $13,410 | $1,860 | $11,550 |
Source: Public Records
Map
Nearby Homes
- 0 E Oxford St
- 62 E High St
- 427 S Union Ave
- 726 S Arch Ave
- 807 S Union Ave
- 452 E Summit St
- 46 Rosenberry St
- 234 Rosenberry St
- 62 E Market St
- 231 Rosenberry St
- V/L S Freedom Ave
- 226 Milner St
- 621 S Haines Ave
- 228 W Oxford St
- 361 E Main St
- 134 11th St
- 203 Glamorgan St
- 163 W Market St
- 167 11th St
- 442 S Liberty Ave
- 52 E Cambridge St
- 71 1/2 E Oxford St
- 71 E Oxford St
- 71 E Oxford St
- 42 E Cambridge St
- 61 E Oxford St
- 116 E Cambridge St
- 118 E Cambridge St
- 49 E Oxford St
- 107 E Cambridge St
- 61 E Cambridge St
- 59 E Cambridge St
- 39 E Cambridge St
- 37 E Oxford St
- 115 E Cambridge St
- 119 E Oxford St
- 125 E Cambridge St
- 444 S Park Ave
- 143 E Oxford St
- 143 E Oxford St
Your Personal Tour Guide
Ask me questions while you tour the home.