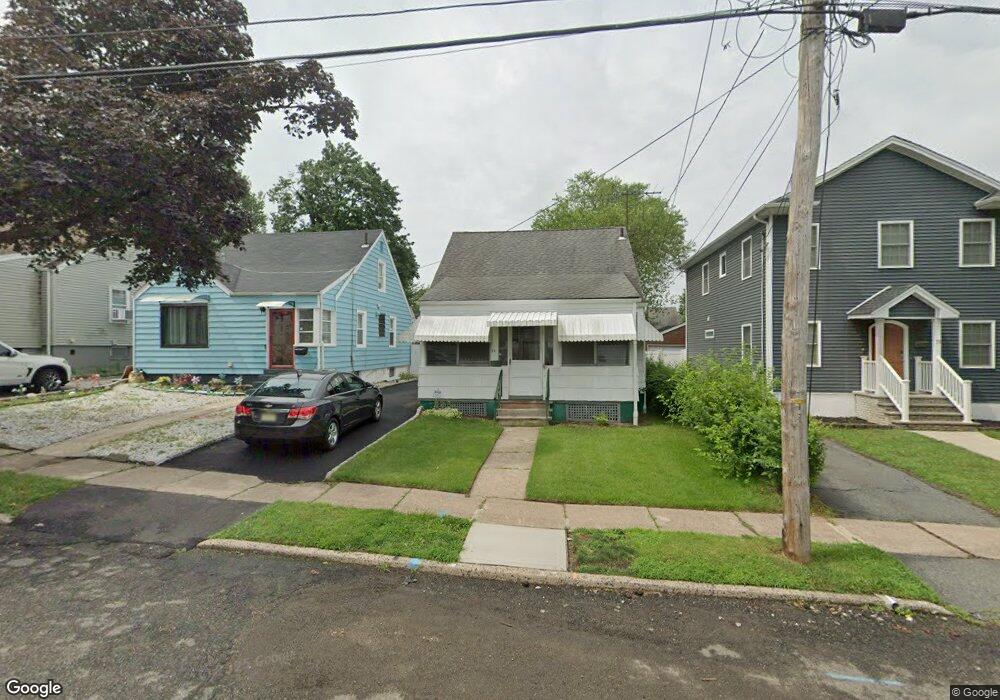
74 Elston St Bloomfield, NJ 07003
Estimated Value: $398,000 - $533,000
--
Bed
--
Bath
1,035
Sq Ft
$454/Sq Ft
Est. Value
About This Home
This home is located at 74 Elston St, Bloomfield, NJ 07003 and is currently estimated at $469,688, approximately $453 per square foot. 74 Elston St is a home located in Essex County with nearby schools including Demarest School, Bloomfield Middle School, and Bloomfield High School.
Ownership History
Date
Name
Owned For
Owner Type
Purchase Details
Closed on
Aug 28, 2019
Sold by
Pittaro Paul and Pittaro Jean M
Bought by
Pittaro Michael and Pittaro Christopher
Current Estimated Value
Purchase Details
Closed on
Jun 21, 2000
Sold by
Sefjack Mark
Bought by
Camarillo Arthur and Camarillo Asvenor B
Home Financials for this Owner
Home Financials are based on the most recent Mortgage that was taken out on this home.
Original Mortgage
$123,500
Interest Rate
8.48%
Create a Home Valuation Report for This Property
The Home Valuation Report is an in-depth analysis detailing your home's value as well as a comparison with similar homes in the area
Home Values in the Area
Average Home Value in this Area
Purchase History
| Date | Buyer | Sale Price | Title Company |
|---|---|---|---|
| Pittaro Michael | -- | -- | |
| Camarillo Arthur | $130,000 | -- |
Source: Public Records
Mortgage History
| Date | Status | Borrower | Loan Amount |
|---|---|---|---|
| Previous Owner | Camarillo Arthur | $123,500 |
Source: Public Records
Tax History Compared to Growth
Tax History
| Year | Tax Paid | Tax Assessment Tax Assessment Total Assessment is a certain percentage of the fair market value that is determined by local assessors to be the total taxable value of land and additions on the property. | Land | Improvement |
|---|---|---|---|---|
| 2025 | $8,719 | $266,800 | $129,200 | $137,600 |
| 2024 | $8,719 | $266,800 | $129,200 | $137,600 |
| 2022 | $8,543 | $266,800 | $129,200 | $137,600 |
| 2021 | $8,386 | $266,800 | $129,200 | $137,600 |
| 2020 | $8,257 | $266,800 | $129,200 | $137,600 |
| 2019 | $8,058 | $202,400 | $113,000 | $89,400 |
| 2018 | $8,023 | $202,400 | $113,000 | $89,400 |
| 2017 | $7,902 | $202,400 | $113,000 | $89,400 |
| 2016 | $7,813 | $202,400 | $113,000 | $89,400 |
| 2015 | $7,742 | $202,400 | $113,000 | $89,400 |
| 2014 | $7,600 | $202,400 | $113,000 | $89,400 |
Source: Public Records
Map
Nearby Homes