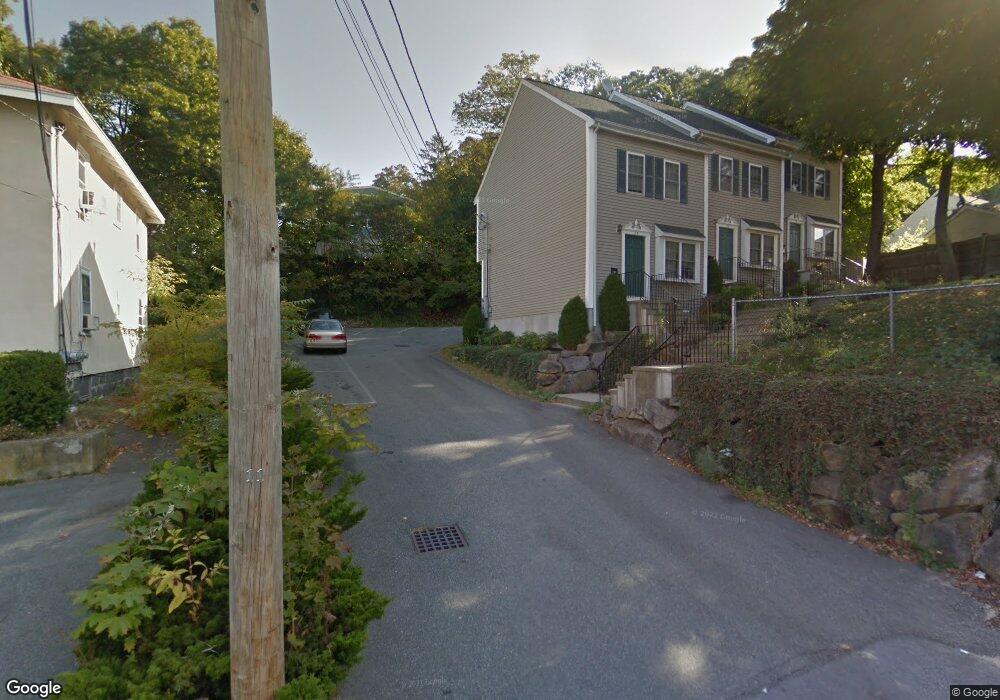
74 Endicott St Quincy, MA 02169
South Quincy NeighborhoodEstimated Value: $1,054,000 - $1,240,000
6
Beds
6
Baths
2,907
Sq Ft
$396/Sq Ft
Est. Value
About This Home
This home is located at 74 Endicott St, Quincy, MA 02169 and is currently estimated at $1,150,333, approximately $395 per square foot. 74 Endicott St is a home located in Norfolk County with nearby schools including Lincoln-Hancock Community School, South West Middle School, and Quincy High School.
Ownership History
Date
Name
Owned For
Owner Type
Purchase Details
Closed on
Jul 13, 2000
Sold by
Venna Richard A
Bought by
R&C Rt
Current Estimated Value
Home Financials for this Owner
Home Financials are based on the most recent Mortgage that was taken out on this home.
Original Mortgage
$432,000
Outstanding Balance
$157,539
Interest Rate
8.5%
Mortgage Type
Purchase Money Mortgage
Estimated Equity
$992,794
Create a Home Valuation Report for This Property
The Home Valuation Report is an in-depth analysis detailing your home's value as well as a comparison with similar homes in the area
Home Values in the Area
Average Home Value in this Area
Purchase History
| Date | Buyer | Sale Price | Title Company |
|---|---|---|---|
| R&C Rt | $75,000 | -- |
Source: Public Records
Mortgage History
| Date | Status | Borrower | Loan Amount |
|---|---|---|---|
| Open | R&C Rt | $432,000 |
Source: Public Records
Tax History Compared to Growth
Tax History
| Year | Tax Paid | Tax Assessment Tax Assessment Total Assessment is a certain percentage of the fair market value that is determined by local assessors to be the total taxable value of land and additions on the property. | Land | Improvement |
|---|---|---|---|---|
| 2025 | $13,264 | $1,150,400 | $294,100 | $856,300 |
| 2024 | $12,631 | $1,120,800 | $280,100 | $840,700 |
| 2023 | $10,950 | $983,800 | $254,600 | $729,200 |
| 2022 | $10,685 | $891,900 | $212,100 | $679,800 |
| 2021 | $11,018 | $907,600 | $212,100 | $695,500 |
| 2020 | $10,568 | $850,200 | $212,100 | $638,100 |
| 2019 | $10,521 | $838,300 | $200,200 | $638,100 |
| 2018 | $8,919 | $668,600 | $185,400 | $483,200 |
| 2017 | $9,065 | $639,700 | $176,600 | $463,100 |
| 2016 | $8,210 | $571,700 | $153,500 | $418,200 |
| 2015 | $8,176 | $560,000 | $153,500 | $406,500 |
| 2014 | $7,500 | $504,700 | $153,500 | $351,200 |
Source: Public Records
Map
Nearby Homes
- 177 Franklin St
- 166 Phipps St
- 50 N Payne St Unit 1
- 50 N Payne St Unit 3
- 50 N Payne St Unit 4
- 86 Alton Rd
- 192 Federal Ave Unit B
- 8 Jackson St Unit B2
- 118 Brook Rd Unit 2
- 94 Brook Rd Unit 3
- 48 Conrad St
- 51 Brook Rd
- 33 Elm St
- 9 Independence Ave Unit 307
- 171-175 Granite St
- 106 Home Park Rd
- 347 Centre St
- 18 Cliveden St Unit 406W
- 18 Cliveden St Unit 201W
- 2 Cliveden St Unit 601E
- 74 Endicott St Unit A
- 76 Endicott St Unit 76
- 70 Endicott St
- 87 Madison Ave
- 17 Richie Rd
- 64 Endicott St Unit 4
- 2-4 Audrey St
- 91 Madison Ave
- 75 Endicott St
- 4 Audrey St Unit 4
- 4 Audrey St
- 4 Audrey St Unit 2
- 2 Audrey St
- 2 Audrey St Unit Two
- 2 Audrey St
- 73 Endicott St
- 21 Richie Rd
- 21 Richie Rd Unit SF
- 95 Madison Ave
- 77 Madison Ave