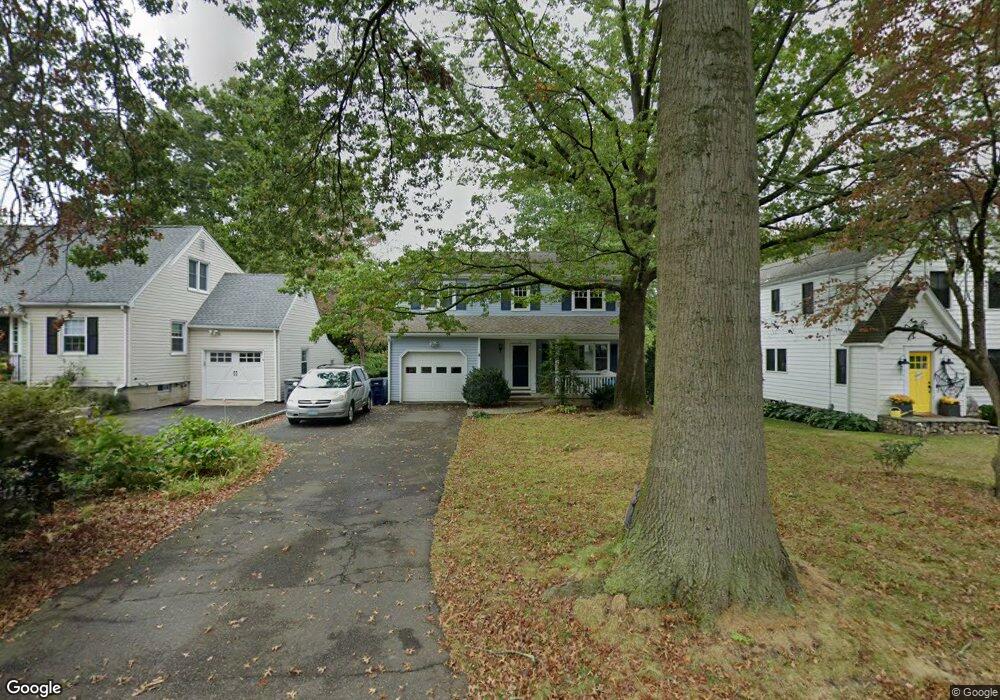
74 Fitch Ave Darien, CT 06820
Estimated Value: $1,731,000 - $2,144,000
5
Beds
4
Baths
2,566
Sq Ft
$747/Sq Ft
Est. Value
About This Home
This home is located at 74 Fitch Ave, Darien, CT 06820 and is currently estimated at $1,916,587, approximately $746 per square foot. 74 Fitch Ave is a home located in Fairfield County with nearby schools including Hindley Elementary School, Middlesex Middle School, and Darien High School.
Ownership History
Date
Name
Owned For
Owner Type
Purchase Details
Closed on
Oct 8, 2003
Sold by
Moody Carrie M
Bought by
Hu Robert B and Zhou Kemin
Current Estimated Value
Purchase Details
Closed on
Dec 3, 1999
Sold by
Mullin Patrick and Mullin Anne G
Bought by
Moody Carrie M
Purchase Details
Closed on
May 13, 1994
Sold by
Wertz David and Wertz Mary
Bought by
Mullin Patrick and Mullin Anne
Purchase Details
Closed on
Mar 14, 1991
Sold by
Kosinski Martha
Bought by
Wertz Mary and Wertz David
Create a Home Valuation Report for This Property
The Home Valuation Report is an in-depth analysis detailing your home's value as well as a comparison with similar homes in the area
Home Values in the Area
Average Home Value in this Area
Purchase History
| Date | Buyer | Sale Price | Title Company |
|---|---|---|---|
| Hu Robert B | $795,000 | -- | |
| Moody Carrie M | $575,000 | -- | |
| Mullin Patrick | $395,000 | -- | |
| Wertz Mary | $324,000 | -- |
Source: Public Records
Mortgage History
| Date | Status | Borrower | Loan Amount |
|---|---|---|---|
| Open | Wertz Mary | $525,000 | |
| Closed | Wertz Mary | $565,000 | |
| Closed | Wertz Mary | $575,000 |
Source: Public Records
Tax History Compared to Growth
Tax History
| Year | Tax Paid | Tax Assessment Tax Assessment Total Assessment is a certain percentage of the fair market value that is determined by local assessors to be the total taxable value of land and additions on the property. | Land | Improvement |
|---|---|---|---|---|
| 2025 | $14,042 | $907,130 | $563,010 | $344,120 |
| 2024 | $13,326 | $907,130 | $563,010 | $344,120 |
| 2023 | $11,998 | $681,310 | $402,150 | $279,160 |
| 2022 | $11,739 | $681,310 | $402,150 | $279,160 |
| 2021 | $11,473 | $681,310 | $402,150 | $279,160 |
| 2020 | $11,146 | $681,310 | $402,150 | $279,160 |
| 2019 | $11,221 | $681,310 | $402,150 | $279,160 |
| 2018 | $11,125 | $691,880 | $356,580 | $335,300 |
| 2017 | $11,181 | $691,880 | $356,580 | $335,300 |
| 2016 | $10,911 | $691,880 | $356,580 | $335,300 |
| 2015 | $10,620 | $691,880 | $356,580 | $335,300 |
| 2014 | $10,385 | $691,880 | $356,580 | $335,300 |
Source: Public Records
Map
Nearby Homes
- 53 Noroton Ave
- 45 Hecker Ave
- 77 Maple St
- 17 Brushy Hill Rd
- 51 Hale Ln Unit 51
- 166 Hollow Tree Ridge Rd
- 130 West Ave
- 128 West Ave
- 92 Pear Tree Point Rd
- 88 Pear Tree Point Rd
- 47 Hollow Tree Ridge Rd
- 19 William St
- 333 West Ave Unit 3
- 10 Stony Brook Rd
- 20 Locust Hill Rd
- 19 Anthony Ln
- 311 Noroton Ave
- 5 Shipway Rd
- 261 Hollow Tree Ridge Rd
- 5 Mayflower Rd