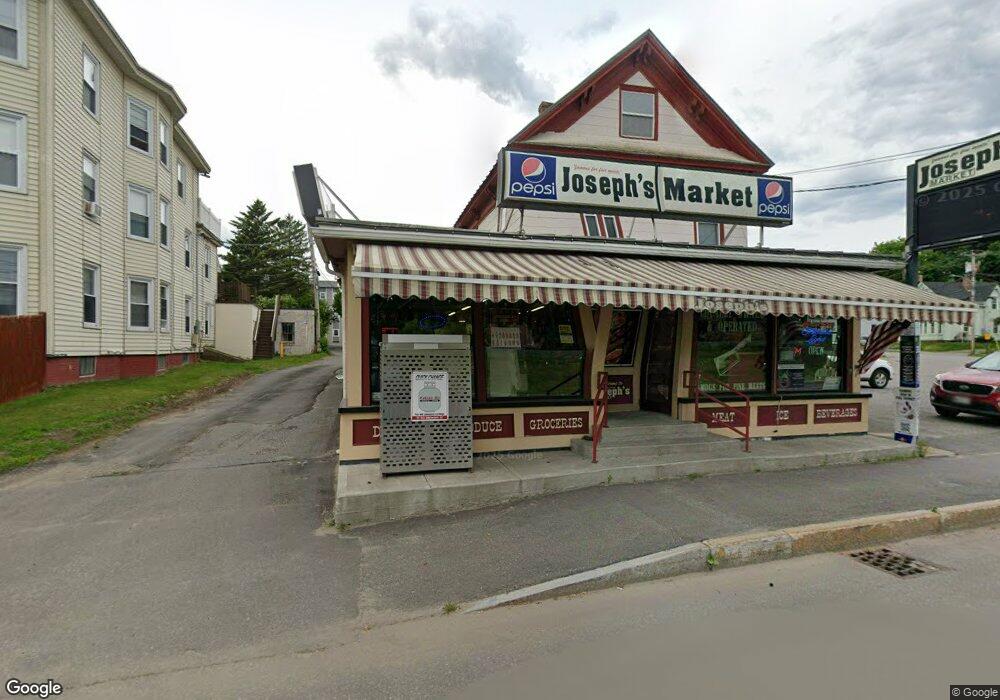
74 Front St Waterville, ME 04901
Estimated Value: $313,878
Studio
2
Baths
7,503
Sq Ft
$42/Sq Ft
Est. Value
About This Home
This home is located at 74 Front St, Waterville, ME 04901 and is currently priced at $313,878, approximately $41 per square foot. 74 Front St is a home located in Kennebec County with nearby schools including George J. Mitchell School, Albert S. Hall School, and Waterville Junior High School.
Ownership History
Date
Name
Owned For
Owner Type
Purchase Details
Closed on
Aug 11, 2025
Sold by
Je Property Division Llc
Bought by
Dlmck Llc
Current Estimated Value
Home Financials for this Owner
Home Financials are based on the most recent Mortgage that was taken out on this home.
Original Mortgage
$280,000
Outstanding Balance
$279,261
Interest Rate
6.67%
Mortgage Type
Purchase Money Mortgage
Purchase Details
Closed on
Aug 6, 2021
Sold by
Dhaka Corp
Bought by
Je Prop Div Llc
Home Financials for this Owner
Home Financials are based on the most recent Mortgage that was taken out on this home.
Original Mortgage
$160,500
Interest Rate
3%
Mortgage Type
Purchase Money Mortgage
Purchase Details
Closed on
Oct 21, 2015
Sold by
John R Joseph & Sons Inc
Bought by
Dhaka Corp
Home Financials for this Owner
Home Financials are based on the most recent Mortgage that was taken out on this home.
Original Mortgage
$200,000
Interest Rate
3.9%
Mortgage Type
Commercial
Create a Home Valuation Report for This Property
The Home Valuation Report is an in-depth analysis detailing your home's value as well as a comparison with similar homes in the area
Home Values in the Area
Average Home Value in this Area
Purchase History
| Date | Buyer | Sale Price | Title Company |
|---|---|---|---|
| Dlmck Llc | -- | -- | |
| Dlmck Llc | -- | -- | |
| Dlmck Llc | -- | -- | |
| Je Prop Div Llc | -- | None Available | |
| Je Prop Div Llc | -- | None Available | |
| Je Prop Div Llc | -- | None Available | |
| Dhaka Corp | -- | -- | |
| Dhaka Corp | -- | -- |
Source: Public Records
Mortgage History
| Date | Status | Borrower | Loan Amount |
|---|---|---|---|
| Open | Dlmck Llc | $280,000 | |
| Closed | Dlmck Llc | $280,000 | |
| Previous Owner | Je Prop Div Llc | $160,500 | |
| Previous Owner | Dhaka Corp | $200,000 |
Source: Public Records
Tax History
| Year | Tax Paid | Tax Assessment Tax Assessment Total Assessment is a certain percentage of the fair market value that is determined by local assessors to be the total taxable value of land and additions on the property. | Land | Improvement |
|---|---|---|---|---|
| 2025 | $4,512 | $265,400 | $56,600 | $208,800 |
| 2024 | $3,974 | $198,700 | $54,900 | $143,800 |
| 2023 | $3,954 | $198,700 | $54,900 | $143,800 |
| 2022 | $3,262 | $126,200 | $35,600 | $90,600 |
| 2021 | $3,218 | $126,200 | $35,600 | $90,600 |
| 2020 | $3,251 | $126,200 | $35,600 | $90,600 |
| 2019 | $3,251 | $126,200 | $35,600 | $90,600 |
| 2018 | $3,189 | $126,200 | $35,600 | $90,600 |
| 2017 | $2,944 | $126,200 | $35,600 | $90,600 |
| 2016 | $2,877 | $126,200 | $35,600 | $90,600 |
| 2015 | $3,478 | $125,100 | $22,700 | $102,400 |
| 2014 | $3,428 | $125,100 | $22,700 | $102,400 |
| 2013 | $3,428 | $125,100 | $22,700 | $102,400 |
Source: Public Records
Map
Nearby Homes
Your Personal Tour Guide
Ask me questions while you tour the home.