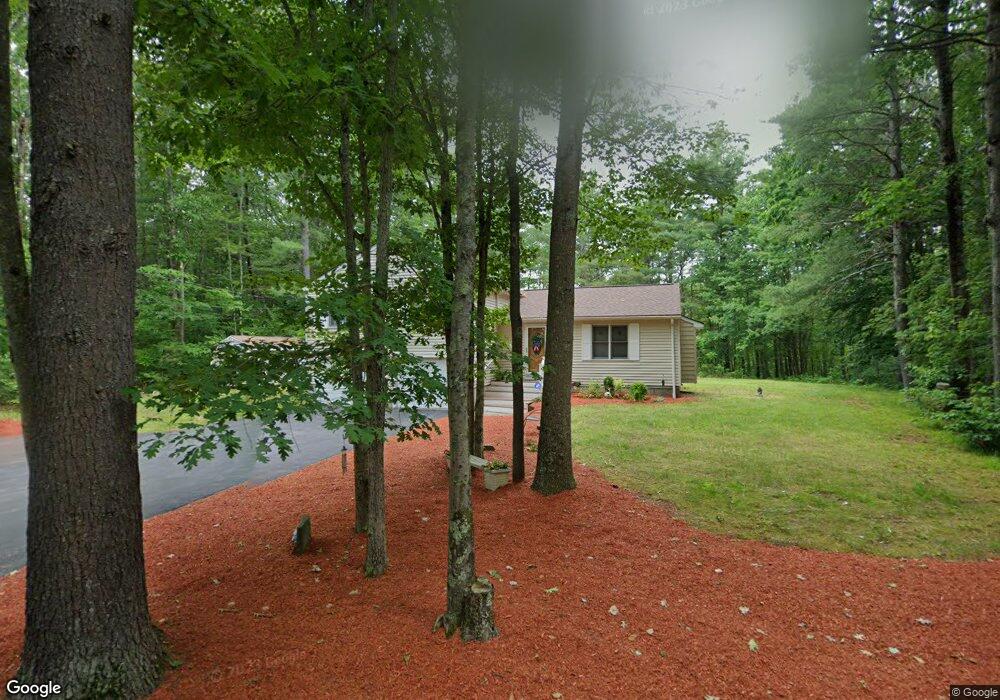
74 Hemlock St Leicester, MA 01524
Estimated Value: $435,000 - $487,000
3
Beds
2
Baths
1,392
Sq Ft
$332/Sq Ft
Est. Value
About This Home
This home is located at 74 Hemlock St, Leicester, MA 01524 and is currently estimated at $461,564, approximately $331 per square foot. 74 Hemlock St is a home located in Worcester County with nearby schools including Leicester Integrated Preschool, Leicester Memorial Elementary School, and Leicester Middle School.
Ownership History
Date
Name
Owned For
Owner Type
Purchase Details
Closed on
Oct 20, 2023
Sold by
Lattinville Joyce C
Bought by
Joyce C Lattinville Ret and Lattinville
Current Estimated Value
Purchase Details
Closed on
Nov 29, 1994
Sold by
Payne Brothers Inc
Bought by
J Pelletz Inc
Purchase Details
Closed on
Oct 18, 1994
Sold by
Stanikmas Joseph and Stanikmas Lydia
Bought by
Lattinville Edward and Lattinville Joyce
Create a Home Valuation Report for This Property
The Home Valuation Report is an in-depth analysis detailing your home's value as well as a comparison with similar homes in the area
Home Values in the Area
Average Home Value in this Area
Purchase History
| Date | Buyer | Sale Price | Title Company |
|---|---|---|---|
| Joyce C Lattinville Ret | -- | None Available | |
| J Pelletz Inc | $26,000 | -- | |
| Lattinville Edward | $21,000 | -- |
Source: Public Records
Mortgage History
| Date | Status | Borrower | Loan Amount |
|---|---|---|---|
| Previous Owner | Lattinville Edward | $132,000 | |
| Previous Owner | Lattinville Edward | $135,000 | |
| Previous Owner | Lattinville Edward | $36,000 |
Source: Public Records
Tax History Compared to Growth
Tax History
| Year | Tax Paid | Tax Assessment Tax Assessment Total Assessment is a certain percentage of the fair market value that is determined by local assessors to be the total taxable value of land and additions on the property. | Land | Improvement |
|---|---|---|---|---|
| 2025 | $44 | $374,800 | $79,900 | $294,900 |
| 2024 | $4,167 | $332,000 | $69,100 | $262,900 |
| 2023 | $3,953 | $307,400 | $69,100 | $238,300 |
| 2022 | $3,825 | $273,400 | $66,100 | $207,300 |
| 2021 | $4,200 | $277,600 | $66,100 | $211,500 |
| 2020 | $3,792 | $254,300 | $63,900 | $190,400 |
| 2019 | $3,598 | $238,600 | $57,400 | $181,200 |
| 2018 | $3,458 | $214,900 | $57,400 | $157,500 |
| 2017 | $3,327 | $214,900 | $57,400 | $157,500 |
| 2016 | $3,245 | $217,800 | $71,500 | $146,300 |
| 2015 | $3,167 | $217,800 | $71,500 | $146,300 |
Source: Public Records
Map
Nearby Homes