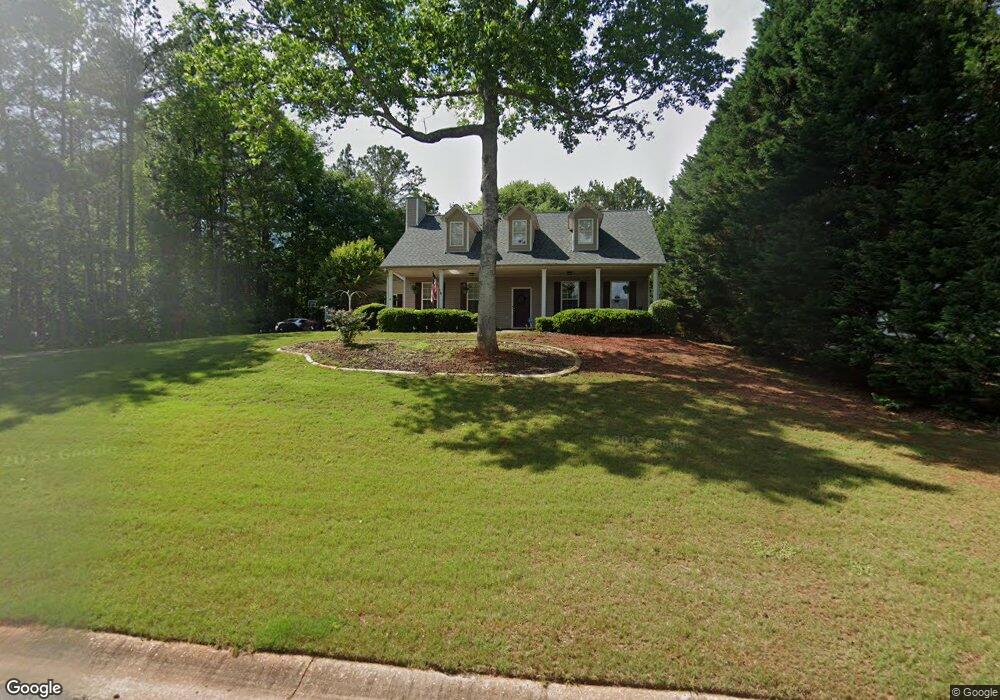
74 Hidden Lakes Ct Newnan, GA 30263
Estimated Value: $314,736 - $388,000
3
Beds
2
Baths
1,850
Sq Ft
$189/Sq Ft
Est. Value
About This Home
This home is located at 74 Hidden Lakes Ct, Newnan, GA 30263 and is currently estimated at $349,434, approximately $188 per square foot. 74 Hidden Lakes Ct is a home located in Coweta County with nearby schools including Newnan Crossing Elementary School, Lee Middle School, and East Coweta High School.
Ownership History
Date
Name
Owned For
Owner Type
Purchase Details
Closed on
Sep 8, 2002
Sold by
Jlj Builders Inc
Bought by
Smith Daisy and Smith Wilma
Current Estimated Value
Home Financials for this Owner
Home Financials are based on the most recent Mortgage that was taken out on this home.
Original Mortgage
$144,400
Outstanding Balance
$61,025
Interest Rate
6.4%
Mortgage Type
New Conventional
Estimated Equity
$288,409
Purchase Details
Closed on
Jan 30, 2002
Sold by
Eyzabuirre William A
Bought by
Jlj Builders Inc
Purchase Details
Closed on
Oct 6, 1999
Sold by
Alliant Properties I
Bought by
Eyzabuirre William A
Purchase Details
Closed on
Jul 7, 1997
Bought by
Alliant Properties I
Purchase Details
Closed on
Dec 27, 1991
Bought by
Hidden Lakes Corpora
Purchase Details
Closed on
Feb 14, 1989
Bought by
Newnan Land Partners
Purchase Details
Closed on
Oct 8, 1982
Bought by
Brown E W
Create a Home Valuation Report for This Property
The Home Valuation Report is an in-depth analysis detailing your home's value as well as a comparison with similar homes in the area
Home Values in the Area
Average Home Value in this Area
Purchase History
| Date | Buyer | Sale Price | Title Company |
|---|---|---|---|
| Smith Daisy | $152,000 | -- | |
| Jlj Builders Inc | $50,000 | -- | |
| Eyzabuirre William A | $110,000 | -- | |
| Alliant Properties I | $180,000 | -- | |
| Hidden Lakes Corpora | $150,000 | -- | |
| Newnan Land Partners | -- | -- | |
| Brown E W | -- | -- |
Source: Public Records
Mortgage History
| Date | Status | Borrower | Loan Amount |
|---|---|---|---|
| Open | Smith Daisy | $144,400 |
Source: Public Records
Tax History Compared to Growth
Tax History
| Year | Tax Paid | Tax Assessment Tax Assessment Total Assessment is a certain percentage of the fair market value that is determined by local assessors to be the total taxable value of land and additions on the property. | Land | Improvement |
|---|---|---|---|---|
| 2025 | $2,684 | $118,465 | $20,000 | $98,465 |
| 2024 | $2,692 | $120,546 | $20,000 | $100,546 |
| 2023 | $2,692 | $100,088 | $20,000 | $80,088 |
| 2022 | $2,260 | $96,446 | $20,000 | $76,446 |
| 2021 | $1,898 | $76,784 | $12,000 | $64,784 |
| 2020 | $1,910 | $76,784 | $12,000 | $64,784 |
| 2019 | $1,940 | $71,095 | $10,000 | $61,095 |
| 2018 | $1,944 | $71,095 | $10,000 | $61,095 |
| 2017 | $1,944 | $71,095 | $10,000 | $61,095 |
| 2016 | $1,923 | $71,095 | $10,000 | $61,095 |
| 2015 | $1,735 | $65,541 | $10,000 | $55,541 |
| 2014 | $1,723 | $65,541 | $10,000 | $55,541 |
Source: Public Records
Map
Nearby Homes
- 84 Hidden Lakes Ct
- 44 Hidden Lakes Ct
- 35 Hidden Lakes Dr
- 49 Preserve Dr
- 131 Greison Trail
- 139 Greison Trail
- 145 Greison Trail
- 10 Lakeshore Pkwy
- 27 Tahoe Dr
- 15 Chestnut Dr
- 233 Merritt Cir
- 267 E Broad St
- 2 Chastain Cir
- 26 Remington Way
- 38 Remington Way
- 127 Chastain Cir
- 123 Chastain Cir
- 175 Chastain Way
- 21 Thomaston St Unit 5
- 23 Umber Ln Unit LOT 23
- 64 Hidden Lakes Ct
- 75 Hidden Lakes Ct
- 79 Hidden Lakes Ct
- 85 Hidden Lakes Ct Unit 9
- 85 Hidden Lakes Ct
- 94 Hidden Lakes Ct
- 452 E Broad St Unit TR A-1
- 452 E Broad St Unit A-1
- 452 E Broad St
- 405 Cliffhaven Cir Unit LT 1
- 405 Cliffhaven Cir Unit 2
- 36 Hidden Lakes Ct
- 3 Cliffhaven Cir Unit 102
- 3 Cliffhaven Cir Unit 174
- 3 Cliffhaven Cir
- 401 Cliffhaven Cir Unit 2
- 7 Cliffhaven Cir Unit 101
- 11 Cliffhaven Cir Unit 100
- 22 Hidden Lakes Ct
- 28 Hidden Lakes Dr