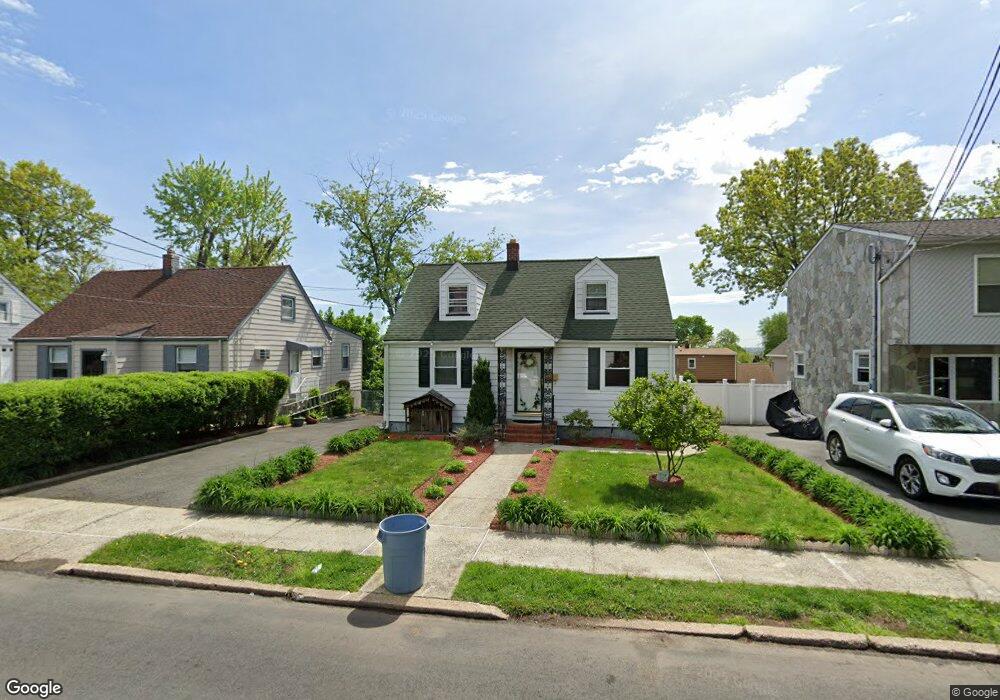
74 Hoover St North Arlington, NJ 07031
Estimated Value: $906,882 - $1,239,000
2
Beds
1
Bath
2,692
Sq Ft
$389/Sq Ft
Est. Value
About This Home
This home is located at 74 Hoover St, North Arlington, NJ 07031 and is currently estimated at $1,046,471, approximately $388 per square foot. 74 Hoover St is a home located in Bergen County with nearby schools including North Arlington Middle School, North Arlington High School, and Sacred Heart School.
Ownership History
Date
Name
Owned For
Owner Type
Purchase Details
Closed on
Aug 19, 2021
Sold by
65 Niagara Street Llc
Bought by
Xhemajli Rustem and Xhemajli Merita
Current Estimated Value
Home Financials for this Owner
Home Financials are based on the most recent Mortgage that was taken out on this home.
Original Mortgage
$570,000
Outstanding Balance
$517,526
Interest Rate
2.8%
Mortgage Type
New Conventional
Estimated Equity
$528,945
Purchase Details
Closed on
Aug 28, 2020
Sold by
Dee Robert Joseph and Dee Kathleen Hannah
Bought by
65 Niagara Street Llc
Purchase Details
Closed on
May 7, 1999
Sold by
Knight Catherine Dee and Cooper Dorothy Dee
Bought by
Dee Bryan John and Dee Robert Joseph
Purchase Details
Closed on
Mar 23, 1999
Sold by
Knight Catherine Dee and Knight James Clark
Bought by
Cooper Dorothy Dee and Dee Raymond Thomas
Create a Home Valuation Report for This Property
The Home Valuation Report is an in-depth analysis detailing your home's value as well as a comparison with similar homes in the area
Home Values in the Area
Average Home Value in this Area
Purchase History
| Date | Buyer | Sale Price | Title Company |
|---|---|---|---|
| Xhemajli Rustem | $770,000 | Empire Title Agency Llc | |
| Xhemajli Rustem | $770,000 | Old Republic Title | |
| 65 Niagara Street Llc | $299,000 | Main Street Ttl & Setmnt Svc | |
| Dee Bryan John | $90,000 | -- | |
| Cooper Dorothy Dee | -- | -- |
Source: Public Records
Mortgage History
| Date | Status | Borrower | Loan Amount |
|---|---|---|---|
| Open | Xhemajli Rustem | $570,000 | |
| Closed | Xhemajli Rustem | $570,000 |
Source: Public Records
Tax History Compared to Growth
Tax History
| Year | Tax Paid | Tax Assessment Tax Assessment Total Assessment is a certain percentage of the fair market value that is determined by local assessors to be the total taxable value of land and additions on the property. | Land | Improvement |
|---|---|---|---|---|
| 2025 | $17,872 | $841,300 | $251,500 | $589,800 |
| 2024 | $17,314 | $775,700 | $237,500 | $538,200 |
| 2023 | $17,023 | $709,000 | $222,500 | $486,500 |
| 2022 | $17,023 | $662,100 | $200,000 | $462,100 |
| 2021 | $7,850 | $280,200 | $185,000 | $95,200 |
| 2020 | $7,612 | $276,400 | $182,500 | $93,900 |
| 2019 | $7,826 | $272,600 | $180,000 | $92,600 |
| 2018 | $7,830 | $268,700 | $177,500 | $91,200 |
| 2017 | $7,743 | $264,800 | $175,000 | $89,800 |
| 2016 | $7,946 | $256,400 | $170,000 | $86,400 |
| 2015 | $7,725 | $256,400 | $170,000 | $86,400 |
| 2014 | $7,402 | $256,400 | $170,000 | $86,400 |
Source: Public Records
Map
Nearby Homes