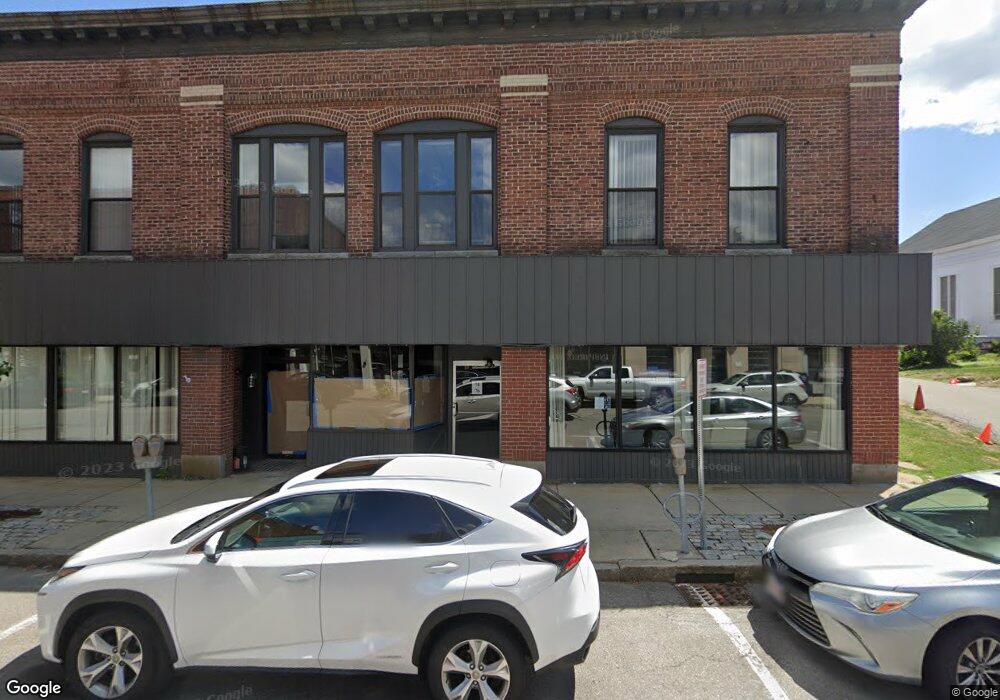
74 Main St Maynard, MA 01754
Estimated Value: $837,337
Studio
--
Bath
10,592
Sq Ft
$79/Sq Ft
Est. Value
About This Home
This home is located at 74 Main St, Maynard, MA 01754 and is currently estimated at $837,337, approximately $79 per square foot. 74 Main St is a home located in Middlesex County with nearby schools including Green Meadow School, Fowler School, and Maynard High School.
Ownership History
Date
Name
Owned For
Owner Type
Purchase Details
Closed on
Dec 8, 2020
Sold by
Quinn Rt 2
Bought by
Mazumdar Realty Llc
Current Estimated Value
Home Financials for this Owner
Home Financials are based on the most recent Mortgage that was taken out on this home.
Original Mortgage
$434,000
Interest Rate
2.8%
Mortgage Type
New Conventional
Purchase Details
Closed on
Oct 7, 1994
Sold by
Church St Corp
Bought by
Rt Quinn and Quinn Edward B
Home Financials for this Owner
Home Financials are based on the most recent Mortgage that was taken out on this home.
Original Mortgage
$225,000
Interest Rate
8.55%
Mortgage Type
Commercial
Purchase Details
Closed on
Nov 16, 1993
Sold by
Summer Est T
Bought by
Chruch St Corp
Create a Home Valuation Report for This Property
The Home Valuation Report is an in-depth analysis detailing your home's value as well as a comparison with similar homes in the area
Home Values in the Area
Average Home Value in this Area
Purchase History
| Date | Buyer | Sale Price | Title Company |
|---|---|---|---|
| Mazumdar Realty Llc | $620,000 | None Available | |
| River Street Rt | $620,000 | None Available | |
| Rt Quinn | $160,000 | -- | |
| Chruch St Corp | $165,000 | -- |
Source: Public Records
Mortgage History
| Date | Status | Borrower | Loan Amount |
|---|---|---|---|
| Previous Owner | River Street Rt | $434,000 | |
| Previous Owner | Chruch St Corp | $225,000 |
Source: Public Records
Tax History
| Year | Tax Paid | Tax Assessment Tax Assessment Total Assessment is a certain percentage of the fair market value that is determined by local assessors to be the total taxable value of land and additions on the property. | Land | Improvement |
|---|---|---|---|---|
| 2025 | $17,972 | $744,500 | $237,300 | $507,200 |
| 2024 | $16,641 | $698,900 | $226,000 | $472,900 |
| 2023 | $16,199 | $641,800 | $204,800 | $437,000 |
| 2022 | $17,560 | $641,800 | $204,800 | $437,000 |
| 2021 | $18,601 | $693,800 | $190,700 | $503,100 |
| 2020 | $19,158 | $686,900 | $183,600 | $503,300 |
| 2019 | $19,824 | $686,900 | $183,600 | $503,300 |
| 2018 | $3,637 | $686,900 | $183,600 | $503,300 |
| 2017 | $20,999 | $686,900 | $183,600 | $503,300 |
| 2016 | $20,312 | $686,900 | $183,600 | $503,300 |
| 2015 | $20,920 | $672,900 | $183,600 | $489,300 |
| 2014 | $21,721 | $672,900 | $183,600 | $489,300 |
Source: Public Records
Map
Nearby Homes
- 38 Fairfield St
- 13 Arthur St Unit 15
- 22 Douglas Ave Unit 2
- 22 Douglas Ave Unit 1
- 5 Hayes St Unit 5
- 31-33 Roosevelt St
- 12 Brown St
- 66 Powder Mill Rd
- 68 Powder Mill Rd
- 70 Powder Mill Rd
- 36 Brown St
- 10 Mill St Unit B
- 41 Taylor Rd
- 23 Deer Path Unit 5
- 153 Summer St
- 63 Conant St
- 8 Snowberry Ln
- 57 Longfellow Rd
- 96 Forest Ridge Rd Unit 96
- 377 Willis Rd
Your Personal Tour Guide
Ask me questions while you tour the home.