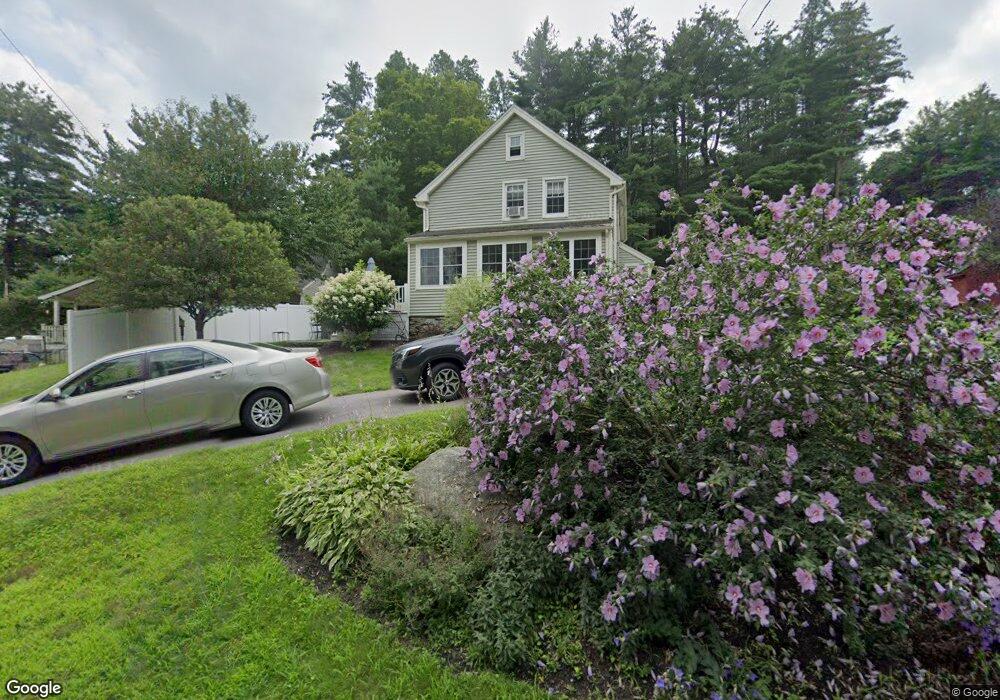
74 Maple St Northborough, MA 01532
Estimated Value: $507,000 - $751,000
4
Beds
3
Baths
1,949
Sq Ft
$311/Sq Ft
Est. Value
About This Home
This home is located at 74 Maple St, Northborough, MA 01532 and is currently estimated at $605,479, approximately $310 per square foot. 74 Maple St is a home located in Worcester County with nearby schools including Marguerite E. Peaslee Elementary School, Robert E. Melican Middle School, and Algonquin Regional High School.
Ownership History
Date
Name
Owned For
Owner Type
Purchase Details
Closed on
Nov 17, 2025
Sold by
Morin Paul E and Morin Cynthia L
Bought by
Morin Ft and Morin
Current Estimated Value
Purchase Details
Closed on
Nov 1, 1979
Bought by
Morin Paul E and Morin Cynthia L
Create a Home Valuation Report for This Property
The Home Valuation Report is an in-depth analysis detailing your home's value as well as a comparison with similar homes in the area
Home Values in the Area
Average Home Value in this Area
Purchase History
| Date | Buyer | Sale Price | Title Company |
|---|---|---|---|
| Morin Ft | -- | -- | |
| Morin Paul E | $49,000 | -- |
Source: Public Records
Mortgage History
| Date | Status | Borrower | Loan Amount |
|---|---|---|---|
| Previous Owner | Morin Paul E | $10,000 | |
| Previous Owner | Morin Paul E | $115,000 | |
| Previous Owner | Morin Paul E | $38,326 |
Source: Public Records
Tax History
| Year | Tax Paid | Tax Assessment Tax Assessment Total Assessment is a certain percentage of the fair market value that is determined by local assessors to be the total taxable value of land and additions on the property. | Land | Improvement |
|---|---|---|---|---|
| 2025 | $6,599 | $463,100 | $248,400 | $214,700 |
| 2024 | $5,916 | $414,300 | $201,100 | $213,200 |
| 2023 | $5,901 | $399,000 | $189,700 | $209,300 |
| 2022 | $5,722 | $347,000 | $180,600 | $166,400 |
| 2021 | $5,478 | $320,000 | $164,000 | $156,000 |
| 2020 | $5,344 | $309,800 | $164,000 | $145,800 |
| 2019 | $4,823 | $281,200 | $164,000 | $117,200 |
| 2018 | $4,506 | $259,100 | $156,500 | $102,600 |
| 2017 | $4,466 | $256,800 | $156,500 | $100,300 |
| 2016 | $4,315 | $251,300 | $153,100 | $98,200 |
| 2015 | $4,825 | $288,400 | $161,400 | $127,000 |
| 2014 | $4,672 | $281,600 | $161,400 | $120,200 |
Source: Public Records
Map
Nearby Homes
- 2 Sterling Ct
- 16 Allen St
- 6 Silas Dr
- 85 Hudson St Unit 85
- 129 Bartlett St
- 106 School St
- 14 Vanessa Dr
- 125 Rice Ave
- 5 Swan View Common Dr
- 5 Country Candle Ln Unit 5
- 15 Dunia Ln Unit 15
- 18 Joseph Rd
- 26 Treetop Cir
- 39 Pleasant St Unit A6
- 39 Pleasant St Unit C5
- 39 Pleasant St Unit A17
- 39 Pleasant St Unit B19
- 39 Pleasant St Unit B10
- 39 Pleasant St Unit B4
- 19 Intervale Farm Ln
Your Personal Tour Guide
Ask me questions while you tour the home.