74 Marjorie Ct Manhasset, NY 11030
Estimated Value: $1,345,000 - $1,489,231
2
Beds
4
Baths
1,616
Sq Ft
$877/Sq Ft
Est. Value
About This Home
This home is located at 74 Marjorie Ct, Manhasset, NY 11030 and is currently estimated at $1,417,116, approximately $876 per square foot. 74 Marjorie Ct is a home located in Nassau County with nearby schools including Manhasset Secondary School, St Mary's Elementary School, and Our Lady of Grace Montessori School.
Ownership History
Date
Name
Owned For
Owner Type
Purchase Details
Closed on
Jul 21, 2015
Sold by
Brody Douglas M and Brody Rachel D
Bought by
Gabriele Sandra
Current Estimated Value
Purchase Details
Closed on
Dec 21, 2009
Sold by
Nelsen Eric and Nelsen Penny
Bought by
Brody Douglas M and Brody Rachel D
Home Financials for this Owner
Home Financials are based on the most recent Mortgage that was taken out on this home.
Original Mortgage
$494,400
Interest Rate
4.85%
Mortgage Type
Purchase Money Mortgage
Purchase Details
Closed on
Apr 1, 1998
Sold by
Augenthaler Debra L
Bought by
Rottmund Francine R
Purchase Details
Closed on
Mar 6, 1997
Create a Home Valuation Report for This Property
The Home Valuation Report is an in-depth analysis detailing your home's value as well as a comparison with similar homes in the area
Home Values in the Area
Average Home Value in this Area
Purchase History
| Date | Buyer | Sale Price | Title Company |
|---|---|---|---|
| Gabriele Sandra | $750,000 | None Available | |
| Brody Douglas M | $618,000 | -- | |
| Rottmund Francine R | $335,000 | -- | |
| -- | -- | -- |
Source: Public Records
Mortgage History
| Date | Status | Borrower | Loan Amount |
|---|---|---|---|
| Previous Owner | Brody Douglas M | $494,400 |
Source: Public Records
Tax History Compared to Growth
Tax History
| Year | Tax Paid | Tax Assessment Tax Assessment Total Assessment is a certain percentage of the fair market value that is determined by local assessors to be the total taxable value of land and additions on the property. | Land | Improvement |
|---|---|---|---|---|
| 2025 | $13,538 | $836 | $361 | $475 |
| 2024 | $4,485 | $836 | $361 | $475 |
| 2023 | $13,096 | $836 | $361 | $475 |
| 2022 | $13,096 | $836 | $361 | $475 |
| 2021 | $13,125 | $834 | $360 | $474 |
| 2020 | $13,188 | $1,280 | $1,118 | $162 |
| 2019 | $12,679 | $1,280 | $1,118 | $162 |
| 2018 | $12,016 | $1,193 | $0 | $0 |
| 2017 | $6,527 | $1,193 | $1,118 | $75 |
| 2016 | $10,295 | $1,193 | $897 | $296 |
| 2015 | $3,595 | $1,193 | $897 | $296 |
| 2014 | $3,595 | $1,193 | $897 | $296 |
| 2013 | $4,263 | $1,487 | $1,118 | $369 |
Source: Public Records
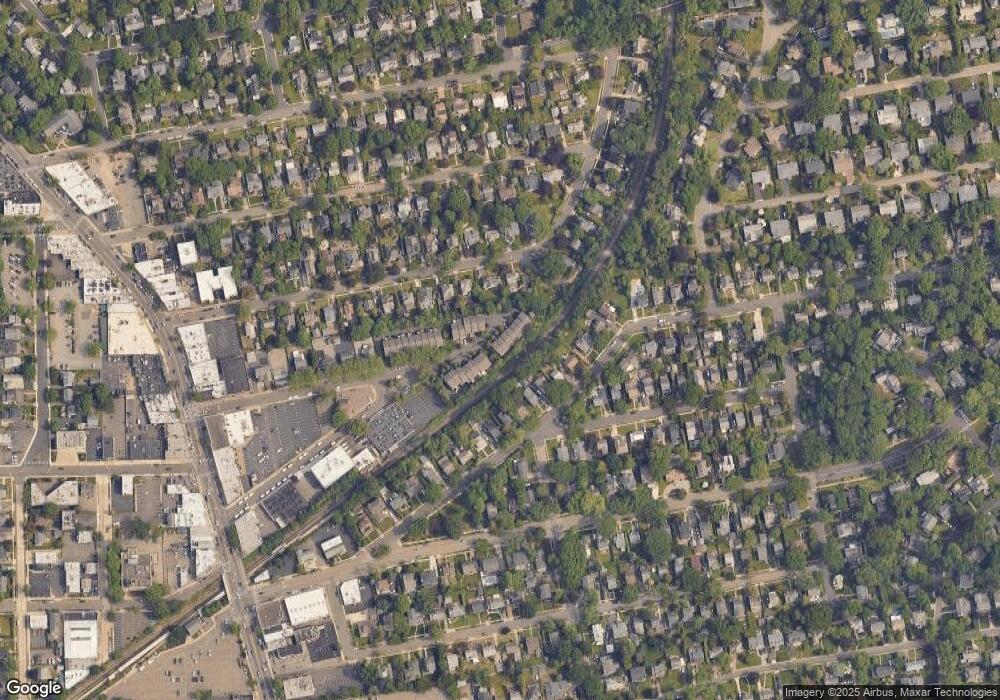
Map
Nearby Homes