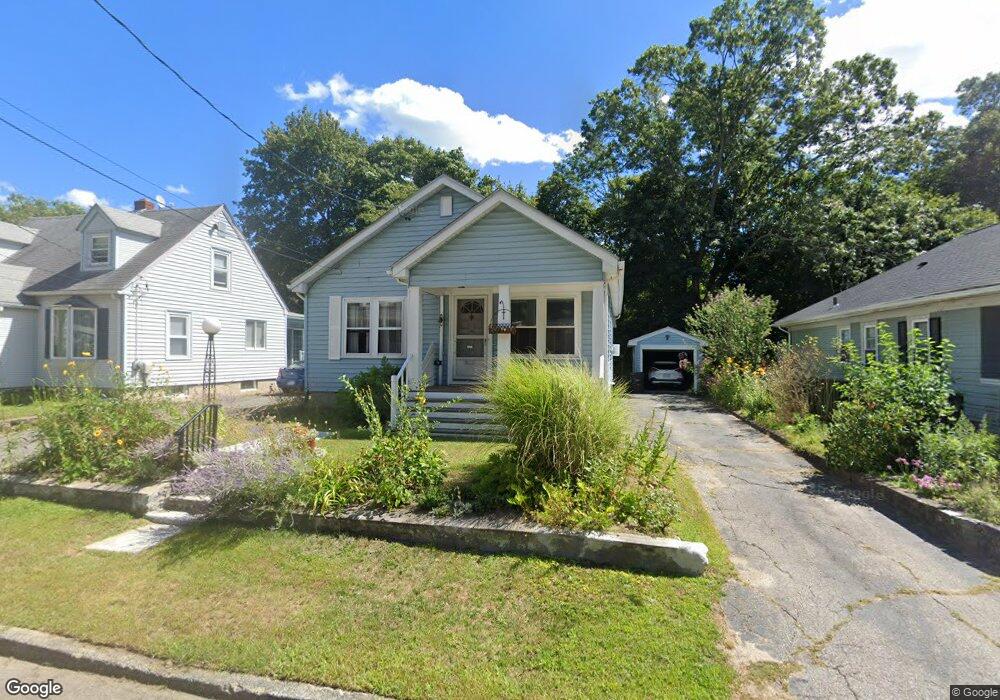
74 Martha St Pawtucket, RI 02860
Fairlawn NeighborhoodEstimated Value: $336,000 - $394,000
2
Beds
1
Bath
832
Sq Ft
$429/Sq Ft
Est. Value
About This Home
This home is located at 74 Martha St, Pawtucket, RI 02860 and is currently estimated at $356,984, approximately $429 per square foot. 74 Martha St is a home located in Providence County with nearby schools including Blackstone Valley Prep Upper Elementary School, Blackstone Valley Prep Junior High School, and Bishop Keough Regional High School.
Ownership History
Date
Name
Owned For
Owner Type
Purchase Details
Closed on
Mar 20, 2024
Sold by
Bouchard Patricia J
Bought by
Skiera Peter
Current Estimated Value
Purchase Details
Closed on
Apr 19, 1989
Sold by
Hopkins Jeffrey G
Bought by
Bouchard Patricia J
Home Financials for this Owner
Home Financials are based on the most recent Mortgage that was taken out on this home.
Original Mortgage
$104,800
Interest Rate
10.79%
Mortgage Type
Purchase Money Mortgage
Create a Home Valuation Report for This Property
The Home Valuation Report is an in-depth analysis detailing your home's value as well as a comparison with similar homes in the area
Home Values in the Area
Average Home Value in this Area
Purchase History
| Date | Buyer | Sale Price | Title Company |
|---|---|---|---|
| Skiera Peter | -- | None Available | |
| Bouchard Patricia J | $104,000 | -- |
Source: Public Records
Mortgage History
| Date | Status | Borrower | Loan Amount |
|---|---|---|---|
| Previous Owner | Bouchard Patricia J | $30,000 | |
| Previous Owner | Bouchard Patricia J | $104,800 |
Source: Public Records
Tax History Compared to Growth
Tax History
| Year | Tax Paid | Tax Assessment Tax Assessment Total Assessment is a certain percentage of the fair market value that is determined by local assessors to be the total taxable value of land and additions on the property. | Land | Improvement |
|---|---|---|---|---|
| 2025 | $2,894 | $220,100 | $89,600 | $130,500 |
| 2024 | $2,716 | $220,100 | $89,600 | $130,500 |
| 2023 | $3,012 | $177,800 | $71,700 | $106,100 |
| 2022 | $2,948 | $177,800 | $71,700 | $106,100 |
| 2021 | $2,948 | $177,800 | $71,700 | $106,100 |
| 2020 | $2,829 | $135,400 | $53,100 | $82,300 |
| 2019 | $2,829 | $135,400 | $53,100 | $82,300 |
| 2018 | $2,726 | $135,400 | $53,100 | $82,300 |
| 2017 | $2,885 | $127,000 | $57,000 | $70,000 |
| 2016 | $2,780 | $127,000 | $57,000 | $70,000 |
| 2015 | $2,780 | $127,000 | $57,000 | $70,000 |
| 2014 | $2,516 | $109,100 | $57,000 | $52,100 |
Source: Public Records
Map
Nearby Homes
- 0 Martha St
- 2 Cobble Hill Rd
- 199 Morris Ave
- 123 Francis Ave
- 804 Smithfield Ave
- 136 Samuel Ave
- 8 Arnold Ave
- 149 Oakdale Ave
- 16 Rufus St
- 3 Arnold Ave
- 132 Hobson Ave
- 221 Columbia Ave
- 101 Cobble Hill Rd
- 424 Smithfield Ave Unit 1
- 422 Smithfield Ave Unit 1
- 12 Atwood Ave
- 27 Stedman Ave
- 122 Elder St
- 936 Smithfield Ave
- 75 Elder St