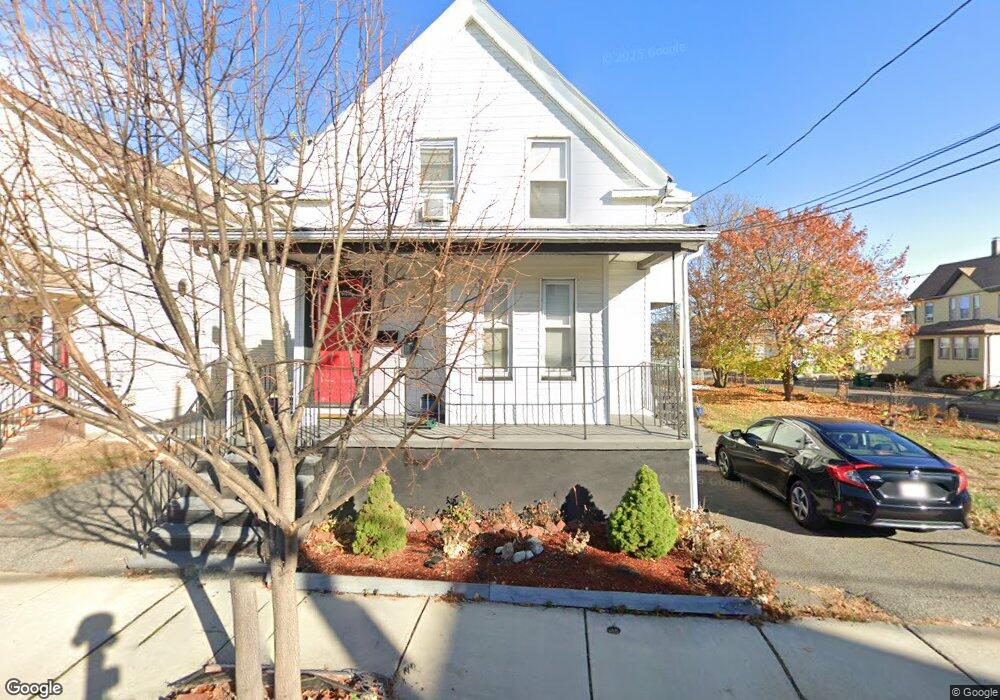
74 Myrtle St Unit 2 Medford, MA 02155
Glenwood NeighborhoodEstimated Value: $1,015,000 - $1,158,847
2
Beds
1
Bath
1,212
Sq Ft
$893/Sq Ft
Est. Value
About This Home
This home is located at 74 Myrtle St Unit 2, Medford, MA 02155 and is currently estimated at $1,082,712, approximately $893 per square foot. 74 Myrtle St Unit 2 is a home located in Middlesex County with nearby schools including Medford High School and Mystic Valley Regional Charter School.
Ownership History
Date
Name
Owned For
Owner Type
Purchase Details
Closed on
Dec 21, 2017
Sold by
Kelly Amani and Kelly Carolyn
Bought by
Pasquale Andreottola I
Current Estimated Value
Purchase Details
Closed on
Jul 3, 2017
Sold by
Amk Re Ventures Llc
Bought by
Kelly Amani
Home Financials for this Owner
Home Financials are based on the most recent Mortgage that was taken out on this home.
Original Mortgage
$472,500
Interest Rate
3.88%
Purchase Details
Closed on
May 15, 2017
Sold by
Amk Re Ventures Llc
Bought by
Kelly Amani
Home Financials for this Owner
Home Financials are based on the most recent Mortgage that was taken out on this home.
Original Mortgage
$472,500
Interest Rate
3.88%
Purchase Details
Closed on
Dec 16, 2016
Sold by
Modugno Mary F
Bought by
Amk Re Ventures Llc
Home Financials for this Owner
Home Financials are based on the most recent Mortgage that was taken out on this home.
Original Mortgage
$483,750
Interest Rate
3.54%
Mortgage Type
New Conventional
Create a Home Valuation Report for This Property
The Home Valuation Report is an in-depth analysis detailing your home's value as well as a comparison with similar homes in the area
Home Values in the Area
Average Home Value in this Area
Purchase History
| Date | Buyer | Sale Price | Title Company |
|---|---|---|---|
| Pasquale Andreottola I | $725,000 | -- | |
| Kelly Amani | $10 | -- | |
| Kelly Amani | -- | -- | |
| Amk Re Ventures Llc | $537,500 | -- |
Source: Public Records
Mortgage History
| Date | Status | Borrower | Loan Amount |
|---|---|---|---|
| Previous Owner | Kelly Amani | $472,500 | |
| Previous Owner | Kelly Amani | -- | |
| Previous Owner | Amk Re Ventures Llc | $483,750 |
Source: Public Records
Tax History Compared to Growth
Tax History
| Year | Tax Paid | Tax Assessment Tax Assessment Total Assessment is a certain percentage of the fair market value that is determined by local assessors to be the total taxable value of land and additions on the property. | Land | Improvement |
|---|---|---|---|---|
| 2025 | $8,108 | $951,600 | $384,400 | $567,200 |
| 2024 | $8,108 | $951,600 | $384,400 | $567,200 |
| 2023 | $7,930 | $916,800 | $359,300 | $557,500 |
| 2022 | $7,967 | $884,200 | $326,700 | $557,500 |
| 2021 | $7,514 | $798,500 | $311,200 | $487,300 |
| 2020 | $7,402 | $806,300 | $311,200 | $495,100 |
| 2019 | $7,058 | $735,200 | $283,000 | $452,200 |
| 2018 | $6,046 | $590,400 | $257,300 | $333,100 |
| 2017 | $5,687 | $538,500 | $240,500 | $298,000 |
| 2016 | $5,537 | $494,800 | $218,600 | $276,200 |
| 2015 | $5,257 | $449,300 | $208,200 | $241,100 |
Source: Public Records
Map
Nearby Homes
- 114 Lawrence St
- 10 Chipman St Unit 10
- 86 Pinkert St
- 216 Central Ave Unit 218
- 159 Central Ave Unit 159
- 18 Sheridan Ave
- 53 Sheridan Ave
- 830 Fellsway
- 320 Middlesex Ave Unit A406
- 320 Middlesex Ave Unit B205
- 320 Middlesex Ave Unit F404
- 320 Middlesex Ave Unit B109
- 68 Central Ave Unit 306
- 124 Grant Ave
- 74 Highland Ave
- 82 2nd St
- 99 4th St Unit 1
- 57 1st St Unit 2
- 162 Emerald St
- 174 West St