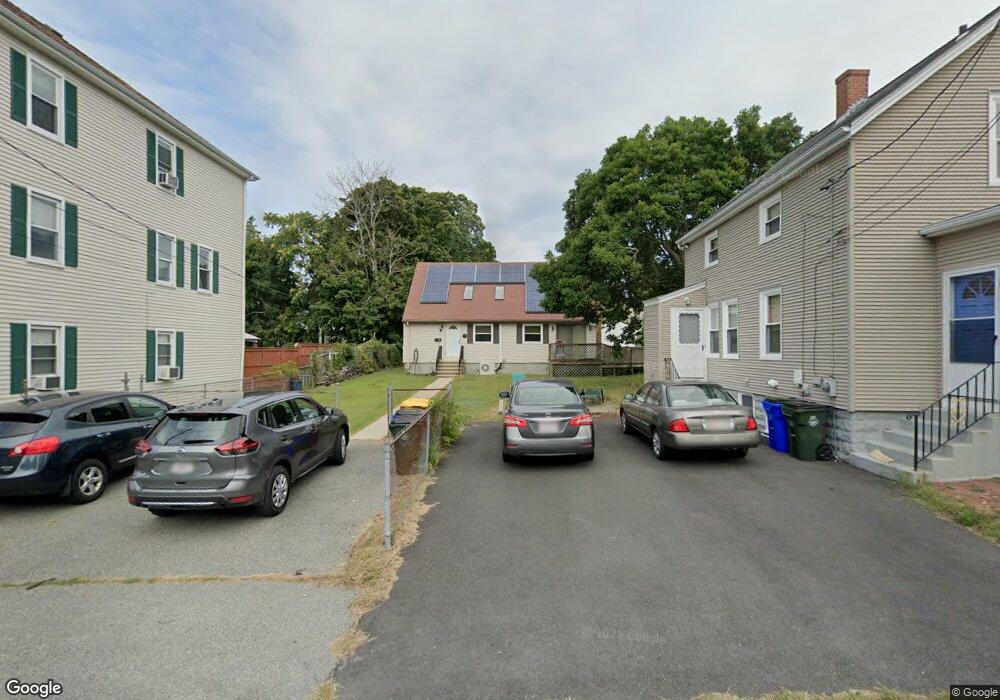
74 Pebble St Fall River, MA 02721
Maplewood NeighborhoodEstimated Value: $443,000 - $494,000
2
Beds
2
Baths
1,759
Sq Ft
$267/Sq Ft
Est. Value
About This Home
This home is located at 74 Pebble St, Fall River, MA 02721 and is currently estimated at $469,778, approximately $267 per square foot. 74 Pebble St is a home located in Bristol County with nearby schools including Letourneau Elementary School, Matthew J. Kuss Middle School, and B M C Durfee High School.
Ownership History
Date
Name
Owned For
Owner Type
Purchase Details
Closed on
Mar 27, 1998
Sold by
Miranda Audrey and Miranda Emanuel C
Bought by
Bell Robert and Bell Rose M
Current Estimated Value
Home Financials for this Owner
Home Financials are based on the most recent Mortgage that was taken out on this home.
Original Mortgage
$100,000
Interest Rate
6.96%
Mortgage Type
Purchase Money Mortgage
Create a Home Valuation Report for This Property
The Home Valuation Report is an in-depth analysis detailing your home's value as well as a comparison with similar homes in the area
Home Values in the Area
Average Home Value in this Area
Purchase History
| Date | Buyer | Sale Price | Title Company |
|---|---|---|---|
| Bell Robert | $119,500 | -- |
Source: Public Records
Mortgage History
| Date | Status | Borrower | Loan Amount |
|---|---|---|---|
| Open | Bell Robert | $120,000 | |
| Closed | Bell Robert | $100,000 | |
| Previous Owner | Bell Robert | $250,000 | |
| Previous Owner | Bell Robert | $15,000 |
Source: Public Records
Tax History Compared to Growth
Tax History
| Year | Tax Paid | Tax Assessment Tax Assessment Total Assessment is a certain percentage of the fair market value that is determined by local assessors to be the total taxable value of land and additions on the property. | Land | Improvement |
|---|---|---|---|---|
| 2025 | $4,453 | $388,900 | $126,800 | $262,100 |
| 2024 | $4,200 | $365,500 | $122,000 | $243,500 |
| 2023 | $4,285 | $349,200 | $104,600 | $244,600 |
| 2022 | $3,773 | $299,000 | $95,100 | $203,900 |
| 2021 | $5,533 | $257,000 | $88,000 | $169,000 |
| 2020 | $3,312 | $229,200 | $84,200 | $145,000 |
| 2019 | $6,256 | $220,200 | $80,200 | $140,000 |
| 2018 | $3,102 | $212,200 | $78,700 | $133,500 |
| 2017 | $2,960 | $211,400 | $80,300 | $131,100 |
| 2016 | $2,834 | $207,900 | $83,600 | $124,300 |
| 2015 | $2,647 | $202,400 | $80,500 | $121,900 |
| 2014 | $2,600 | $206,700 | $84,800 | $121,900 |
Source: Public Records
Map
Nearby Homes