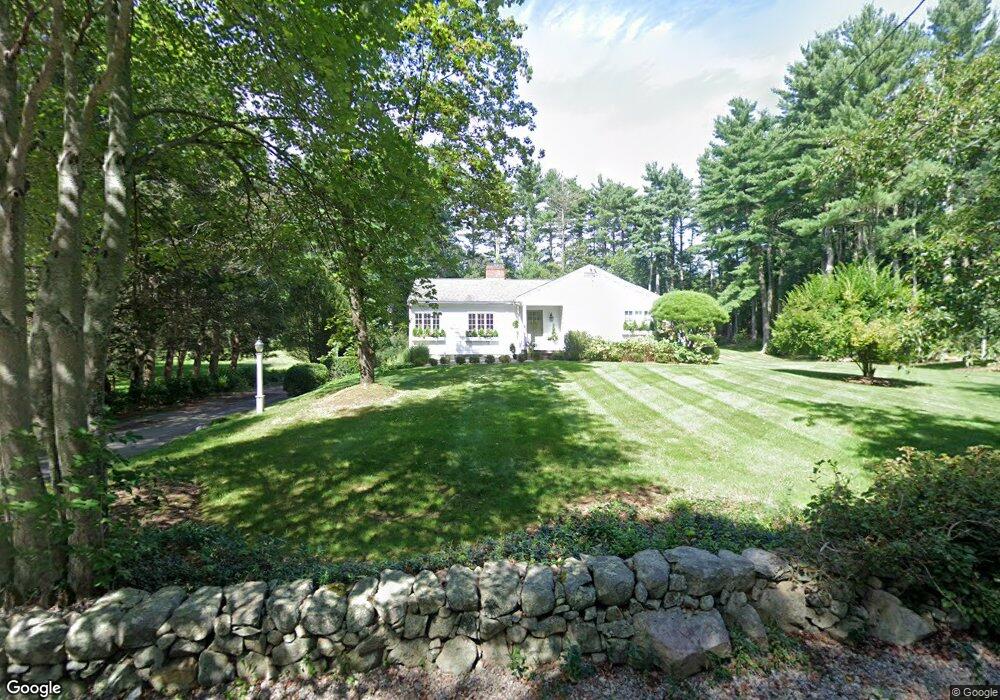
74 Philip St Medfield, MA 02052
Estimated Value: $824,012 - $868,000
2
Beds
2
Baths
1,802
Sq Ft
$467/Sq Ft
Est. Value
About This Home
This home is located at 74 Philip St, Medfield, MA 02052 and is currently estimated at $842,253, approximately $467 per square foot. 74 Philip St is a home located in Norfolk County with nearby schools including Ralph Wheelock School, Memorial School, and Dale Street School.
Ownership History
Date
Name
Owned For
Owner Type
Purchase Details
Closed on
Sep 30, 1996
Sold by
Cashman Elene S and Cashman James J
Bought by
Larkin Carol A
Current Estimated Value
Home Financials for this Owner
Home Financials are based on the most recent Mortgage that was taken out on this home.
Original Mortgage
$190,000
Interest Rate
7.83%
Mortgage Type
Purchase Money Mortgage
Create a Home Valuation Report for This Property
The Home Valuation Report is an in-depth analysis detailing your home's value as well as a comparison with similar homes in the area
Home Values in the Area
Average Home Value in this Area
Purchase History
| Date | Buyer | Sale Price | Title Company |
|---|---|---|---|
| Larkin Carol A | $220,000 | -- | |
| Larkin Carol A | $220,000 | -- |
Source: Public Records
Mortgage History
| Date | Status | Borrower | Loan Amount |
|---|---|---|---|
| Open | Larkin Carol A | $360,000 | |
| Closed | Larkin Carol A | $195,000 | |
| Closed | Larkin Carol A | $190,000 |
Source: Public Records
Tax History Compared to Growth
Tax History
| Year | Tax Paid | Tax Assessment Tax Assessment Total Assessment is a certain percentage of the fair market value that is determined by local assessors to be the total taxable value of land and additions on the property. | Land | Improvement |
|---|---|---|---|---|
| 2025 | $10,311 | $747,200 | $486,700 | $260,500 |
| 2024 | $10,011 | $683,800 | $441,500 | $242,300 |
| 2023 | $9,960 | $645,500 | $421,500 | $224,000 |
| 2022 | $9,766 | $560,600 | $401,500 | $159,100 |
| 2021 | $9,461 | $532,700 | $391,500 | $141,200 |
| 2020 | $9,334 | $523,500 | $387,500 | $136,000 |
| 2019 | $9,146 | $511,800 | $381,500 | $130,300 |
| 2018 | $8,365 | $491,200 | $369,500 | $121,700 |
| 2017 | $8,011 | $474,300 | $352,600 | $121,700 |
| 2016 | $7,991 | $477,100 | $342,600 | $134,500 |
| 2015 | $6,929 | $432,000 | $313,400 | $118,600 |
| 2014 | $7,080 | $439,200 | $320,600 | $118,600 |
Source: Public Records
Map
Nearby Homes
- 15 Belknap Rd
- 21 Philip St
- 94 Elm St
- 111 Elm St
- 435 Main St Unit B
- 431 Main St Unit 5
- 44 Millbrook Ave
- 17 Bridle Path
- 34 Frairy St
- 46 Frairy St
- 11 Garry Dr
- 8 Turtlebrook Way
- 4 Lost Brook Trail
- 21 Winter St
- 270 South St
- 19 and 23 Arlington Ln
- 14 Harding St
- 18 Tisdale Dr Unit 18
- 3 Shining Valley Cir
- 9 Schaffner Ln