74 Plateau Cir West Springfield, MA 01089
Estimated Value: $302,000 - $360,000
4
Beds
1
Bath
1,778
Sq Ft
$188/Sq Ft
Est. Value
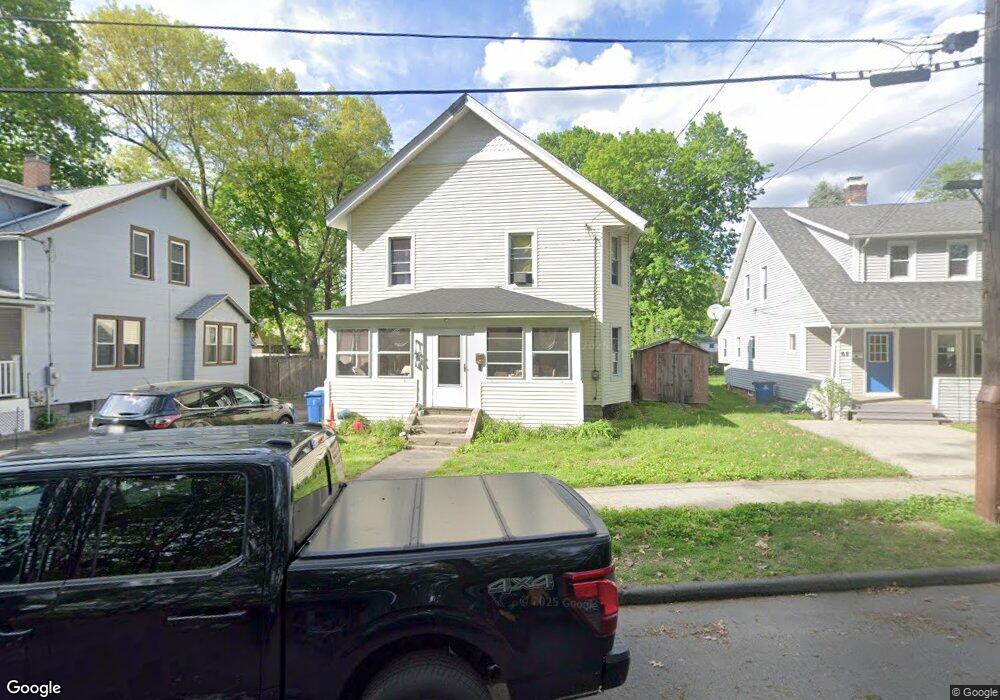
About This Home
This home is located at 74 Plateau Cir, West Springfield, MA 01089 and is currently estimated at $333,906, approximately $187 per square foot. 74 Plateau Cir is a home located in Hampden County with nearby schools including West Springfield High School, Hampden Charter School of Science West, and St Thomas The Apostle School.
Ownership History
Date
Name
Owned For
Owner Type
Purchase Details
Closed on
Oct 12, 2021
Sold by
Romano David A
Bought by
Roman Robin and Romano Cherish
Current Estimated Value
Home Financials for this Owner
Home Financials are based on the most recent Mortgage that was taken out on this home.
Original Mortgage
$129,500
Outstanding Balance
$118,092
Interest Rate
2.8%
Mortgage Type
Stand Alone Refi Refinance Of Original Loan
Estimated Equity
$215,814
Purchase Details
Closed on
Aug 15, 1994
Sold by
Marsh John F and Marsh Claire E
Bought by
Romano David A and Romano Robin L
Home Financials for this Owner
Home Financials are based on the most recent Mortgage that was taken out on this home.
Original Mortgage
$88,954
Interest Rate
8.52%
Mortgage Type
Purchase Money Mortgage
Create a Home Valuation Report for This Property
The Home Valuation Report is an in-depth analysis detailing your home's value as well as a comparison with similar homes in the area
Home Values in the Area
Average Home Value in this Area
Purchase History
| Date | Buyer | Sale Price | Title Company |
|---|---|---|---|
| Roman Robin | -- | None Available | |
| Romano Robin L | -- | None Available | |
| Roman Robin | -- | None Available | |
| Romano David A | $89,000 | -- | |
| Romano David A | $89,000 | -- |
Source: Public Records
Mortgage History
| Date | Status | Borrower | Loan Amount |
|---|---|---|---|
| Open | Roman Robin | $129,500 | |
| Previous Owner | Romano David A | $30,000 | |
| Previous Owner | Romano David A | $88,954 | |
| Previous Owner | Romano David A | $40,000 |
Source: Public Records
Tax History Compared to Growth
Tax History
| Year | Tax Paid | Tax Assessment Tax Assessment Total Assessment is a certain percentage of the fair market value that is determined by local assessors to be the total taxable value of land and additions on the property. | Land | Improvement |
|---|---|---|---|---|
| 2025 | $4,143 | $278,600 | $98,700 | $179,900 |
| 2024 | $3,892 | $262,800 | $98,700 | $164,100 |
| 2023 | $3,650 | $234,900 | $96,600 | $138,300 |
| 2022 | $3,291 | $208,800 | $87,700 | $121,100 |
| 2021 | $3,189 | $188,700 | $80,700 | $108,000 |
| 2020 | $3,101 | $182,500 | $80,700 | $101,800 |
| 2019 | $3,095 | $182,500 | $80,700 | $101,800 |
| 2018 | $3,112 | $182,500 | $80,700 | $101,800 |
| 2017 | $3,112 | $182,500 | $80,700 | $101,800 |
| 2016 | $3,019 | $177,700 | $75,900 | $101,800 |
| 2015 | $3,116 | $183,400 | $74,400 | $109,000 |
| 2014 | $756 | $183,400 | $74,400 | $109,000 |
Source: Public Records
Map
Nearby Homes
- Lot 10 Ahiska Rd
- 21 High St
- 120 Hampden St
- 44 Spring St
- 92 Grove St
- 53 Druids Ln
- 30 Chestnut St
- 369 Cold Spring Ave
- 278 Elm St
- 25 Hillcrest St
- 95 Park Ave Unit 1
- 31 Colony Rd
- 27 Park Avenue Ct Unit 8
- 32 Colony Rd Unit 1
- 56 Exposition Terrace
- 45 Elm Cir
- 36 Maple Terrace
- 145 Amostown Rd
- 12 Cedar Ave
- 44 Spring St