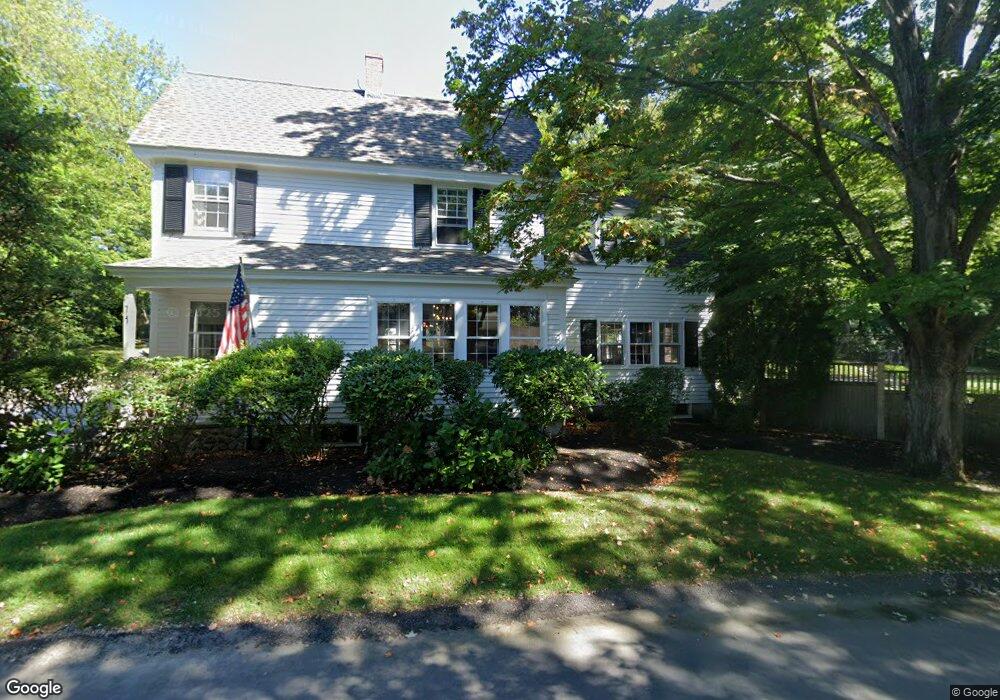
74 Pleasant St Hingham, MA 02043
Estimated Value: $1,972,000 - $2,421,000
4
Beds
3
Baths
3,088
Sq Ft
$723/Sq Ft
Est. Value
About This Home
This home is located at 74 Pleasant St, Hingham, MA 02043 and is currently estimated at $2,232,124, approximately $722 per square foot. 74 Pleasant St is a home located in Plymouth County with nearby schools including East Elementary School, Hingham Middle School, and Hingham High School.
Ownership History
Date
Name
Owned For
Owner Type
Purchase Details
Closed on
Feb 19, 2010
Sold by
Stonkus Mark A and Stonkus Tiffany A
Bought by
Foraste Kenneth C and Foraste Joy L
Current Estimated Value
Home Financials for this Owner
Home Financials are based on the most recent Mortgage that was taken out on this home.
Original Mortgage
$523,750
Interest Rate
5.17%
Mortgage Type
Purchase Money Mortgage
Purchase Details
Closed on
Mar 31, 2008
Sold by
Stonkus Mark A and Stonkus Tiffany A
Bought by
Stonkus Mark A and Stonkus Tiffany A
Purchase Details
Closed on
Aug 17, 2007
Sold by
Dolan Farrell J and Dolan Dianne S
Bought by
Villani Stephen A and Villani Patricia A
Purchase Details
Closed on
Jun 24, 1994
Sold by
Winchester Rt and Winchester Steven C
Bought by
Dolan Farrell J and Dolan Dianne S
Create a Home Valuation Report for This Property
The Home Valuation Report is an in-depth analysis detailing your home's value as well as a comparison with similar homes in the area
Purchase History
| Date | Buyer | Sale Price | Title Company |
|---|---|---|---|
| Foraste Kenneth C | $1,050,000 | -- | |
| Stonkus Mark A | -- | -- | |
| Villani Stephen A | $1,223,000 | -- | |
| Dolan Farrell J | $385,000 | -- |
Source: Public Records
Mortgage History
| Date | Status | Borrower | Loan Amount |
|---|---|---|---|
| Open | Dolan Farrell J | $350,000 | |
| Open | Dolan Farrell J | $523,750 | |
| Closed | Foraste Kenneth C | $523,750 |
Source: Public Records
Tax History
| Year | Tax Paid | Tax Assessment Tax Assessment Total Assessment is a certain percentage of the fair market value that is determined by local assessors to be the total taxable value of land and additions on the property. | Land | Improvement |
|---|---|---|---|---|
| 2025 | $17,582 | $1,644,700 | $622,500 | $1,022,200 |
| 2024 | $17,610 | $1,623,000 | $622,500 | $1,000,500 |
| 2023 | $15,926 | $1,592,600 | $622,500 | $970,100 |
| 2022 | $15,712 | $1,359,200 | $561,900 | $797,300 |
| 2021 | $14,903 | $1,263,000 | $540,300 | $722,700 |
| 2020 | $14,562 | $1,263,000 | $540,300 | $722,700 |
| 2019 | $14,779 | $1,251,400 | $540,300 | $711,100 |
| 2018 | $6,232 | $1,232,000 | $540,300 | $691,700 |
| 2017 | $6,092 | $1,165,200 | $561,900 | $603,300 |
| 2016 | $14,216 | $1,138,200 | $534,900 | $603,300 |
| 2015 | $13,936 | $1,112,200 | $508,900 | $603,300 |
Source: Public Records
Map
Nearby Homes
Your Personal Tour Guide
Ask me questions while you tour the home.