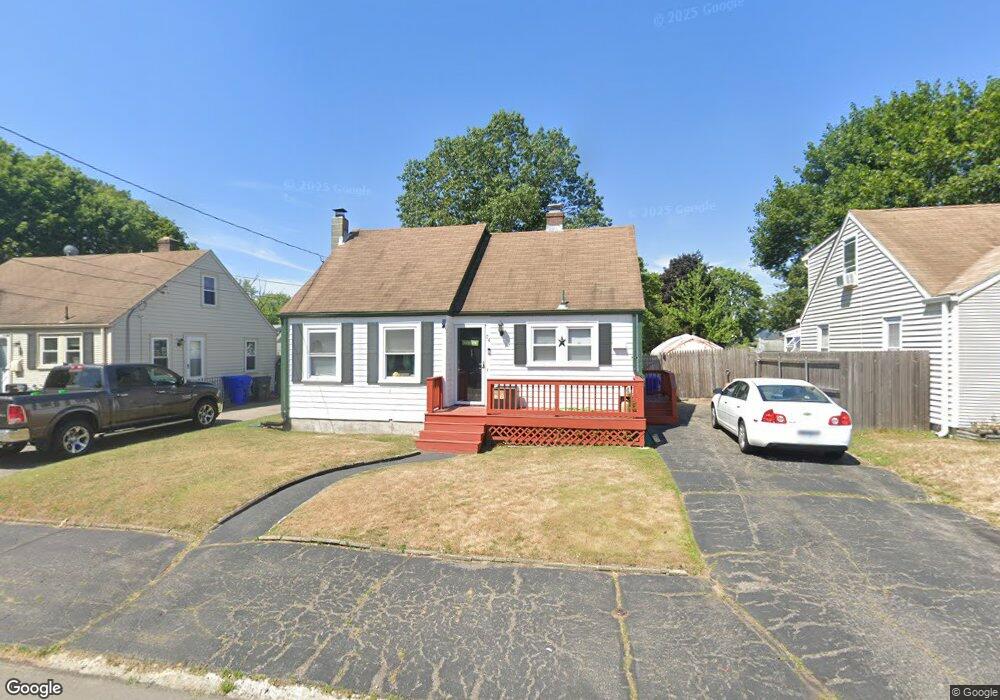
74 Revere St Pawtucket, RI 02861
Darlington NeighborhoodEstimated Value: $396,133 - $482,000
3
Beds
1
Bath
1,248
Sq Ft
$348/Sq Ft
Est. Value
About This Home
This home is located at 74 Revere St, Pawtucket, RI 02861 and is currently estimated at $434,033, approximately $347 per square foot. 74 Revere St is a home located in Providence County with nearby schools including St Cecilia School and Dayspring Christian Academy.
Ownership History
Date
Name
Owned For
Owner Type
Purchase Details
Closed on
May 31, 2017
Sold by
Smith Janet D
Bought by
Smith Janet D and Stanton Timothy M
Current Estimated Value
Purchase Details
Closed on
Oct 18, 2006
Sold by
Smith Janet D and Smith James A
Bought by
Smith Janet D
Home Financials for this Owner
Home Financials are based on the most recent Mortgage that was taken out on this home.
Original Mortgage
$214,000
Interest Rate
6.31%
Purchase Details
Closed on
Sep 14, 1990
Sold by
Harrocks Pauline R
Bought by
Smith James A
Home Financials for this Owner
Home Financials are based on the most recent Mortgage that was taken out on this home.
Original Mortgage
$117,800
Interest Rate
9.76%
Mortgage Type
Purchase Money Mortgage
Create a Home Valuation Report for This Property
The Home Valuation Report is an in-depth analysis detailing your home's value as well as a comparison with similar homes in the area
Home Values in the Area
Average Home Value in this Area
Purchase History
| Date | Buyer | Sale Price | Title Company |
|---|---|---|---|
| Smith Janet D | -- | -- | |
| Smith Janet D | -- | -- | |
| Smith James A | $124,000 | -- |
Source: Public Records
Mortgage History
| Date | Status | Borrower | Loan Amount |
|---|---|---|---|
| Previous Owner | Smith James A | $214,000 | |
| Previous Owner | Smith James A | $173,000 | |
| Previous Owner | Smith James A | $129,500 | |
| Previous Owner | Smith James A | $117,800 |
Source: Public Records
Tax History Compared to Growth
Tax History
| Year | Tax Paid | Tax Assessment Tax Assessment Total Assessment is a certain percentage of the fair market value that is determined by local assessors to be the total taxable value of land and additions on the property. | Land | Improvement |
|---|---|---|---|---|
| 2025 | $4,403 | $334,800 | $150,200 | $184,600 |
| 2024 | $4,131 | $334,800 | $150,200 | $184,600 |
| 2023 | $4,050 | $239,100 | $81,900 | $157,200 |
| 2022 | $3,964 | $239,100 | $81,900 | $157,200 |
| 2021 | $3,964 | $239,100 | $81,900 | $157,200 |
| 2020 | $4,226 | $202,300 | $85,300 | $117,000 |
| 2019 | $4,226 | $202,300 | $85,300 | $117,000 |
| 2018 | $4,072 | $202,300 | $85,300 | $117,000 |
| 2017 | $4,276 | $188,200 | $86,400 | $101,800 |
| 2016 | $4,120 | $188,200 | $86,400 | $101,800 |
| 2015 | $4,120 | $188,200 | $86,400 | $101,800 |
| 2014 | $3,941 | $170,900 | $74,500 | $96,400 |
Source: Public Records
Map
Nearby Homes