74 Ruby Dr Claymont, DE 19703
Estimated Value: $376,000 - $391,000
About This Home
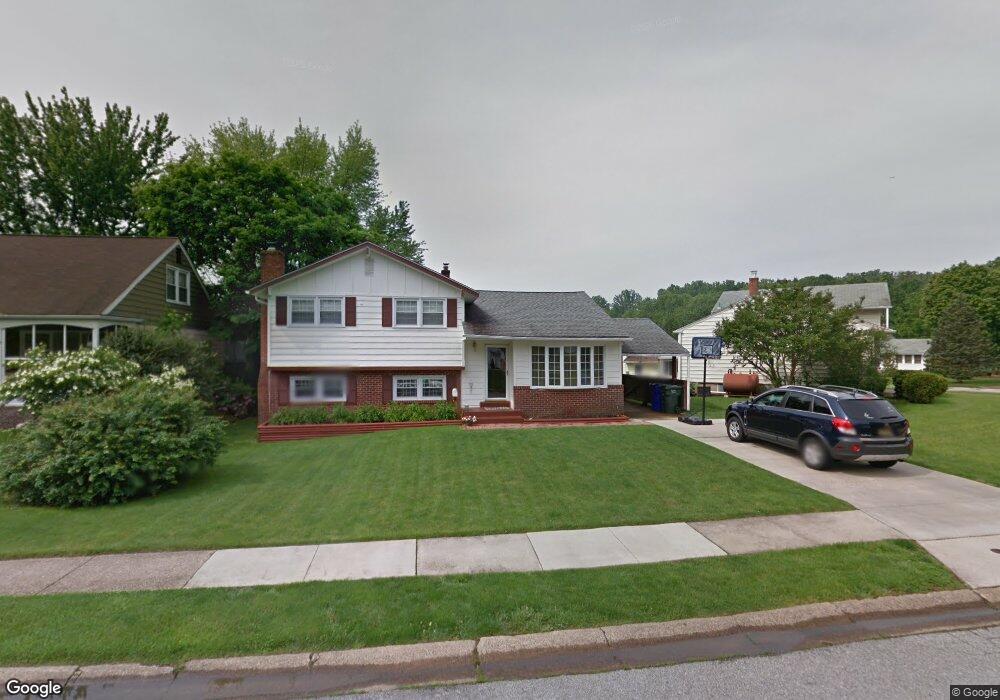
This home is located at 74 Ruby Dr, Claymont, DE 19703 and is currently estimated at $384,336, approximately $216 per square foot. 74 Ruby Dr is a home located in New Castle County with nearby schools including Claymont Elementary School, Talley Middle School, and Mount Pleasant High School.
Ownership History
We collect this data history from publicly available records. To have your information removed, we recommend requesting removal directly through your county’s website.
Purchase Details
Purchase Details
Purchase Details
Home Financials for this Owner
Home Financials are based on the most recent Mortgage that was taken out on this home.Home Values in the Area
Average Home Value in this Area
Purchase History
We collect this data history from publicly available records. To have your information removed, we recommend requesting removal directly through your county’s website.
| Date | Buyer | Sale Price | Title Company |
|---|---|---|---|
| -- | None Listed On Document | ||
| -- | None Available | ||
| $134,000 | Ticor Title Insurance Compan |
Mortgage History
We collect this data history from publicly available records. To have your information removed, we recommend requesting removal directly through your county’s website.
| Date | Status | Borrower | Loan Amount |
|---|---|---|---|
| Previous Owner | $107,200 |
Tax History
We collect this data history from publicly available records. To have your information removed, we recommend requesting removal directly through your county’s website.
| Year | Tax Paid | Tax Assessment Tax Assessment Total Assessment is a certain percentage of the fair market value that is determined by local assessors to be the total taxable value of land and additions on the property. | Land | Improvement |
|---|---|---|---|---|
| 2025 | $2,746 | $361,000 | $70,000 | $291,000 |
| 2024 | $2,047 | $53,800 | $11,400 | $42,400 |
| 2023 | $1,871 | $53,800 | $11,400 | $42,400 |
| 2022 | $1,903 | $53,800 | $11,400 | $42,400 |
| 2021 | $1,903 | $53,800 | $11,400 | $42,400 |
| 2020 | $1,903 | $53,800 | $11,400 | $42,400 |
| 2019 | $1,935 | $53,800 | $11,400 | $42,400 |
| 2018 | $1,819 | $53,800 | $11,400 | $42,400 |
| 2017 | $1,791 | $53,800 | $11,400 | $42,400 |
| 2016 | $1,790 | $53,800 | $11,400 | $42,400 |
| 2015 | $1,647 | $53,800 | $11,400 | $42,400 |
| 2014 | $1,646 | $53,800 | $11,400 | $42,400 |
Map
- 178 W Shelley Dr
- 141 S Shelley Dr
- 10 South Trail
- 16 N Avon Dr
- 111 Wentworth Dr
- 726 Plumtree Ln
- 107 Olympia Dr
- 716 Elmtree Ln
- 1020 Jeffrey Rd
- 1007 Stonewood Rd
- 55 Miles Rd
- 1519 Appletree Ln
- 3523 Naamans Dr
- 15 Ravine Rd
- 3630 Topaz Dr
- 620 Mccomb Place
- 453 Lenape Way
- 3847 Green St
- 1255 Parish Ave
- 1347 Parish Ave
Ask me questions while you tour the home.