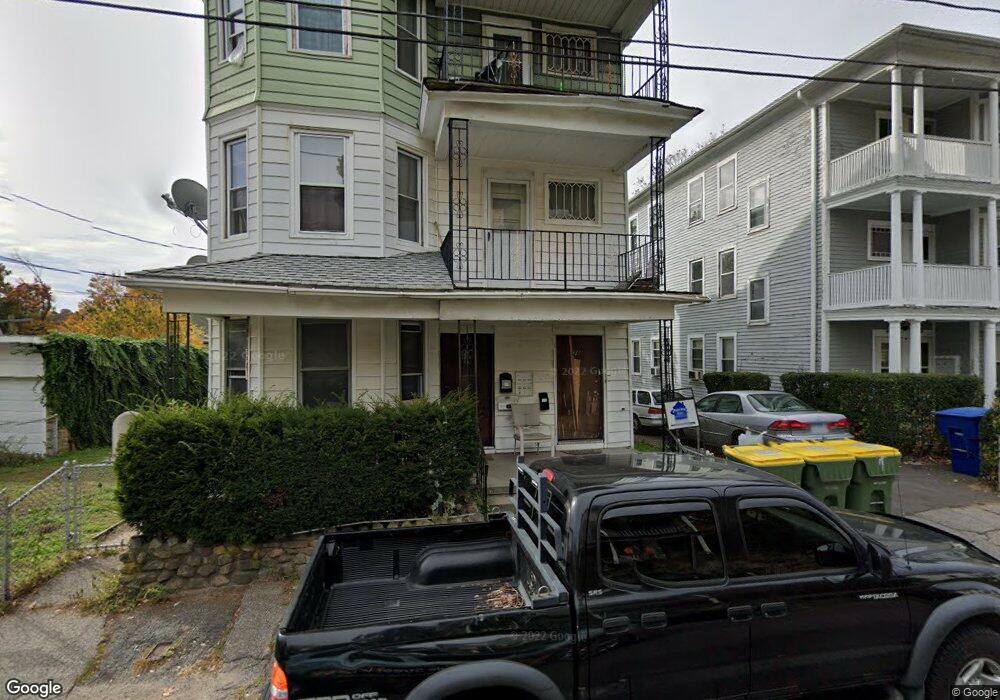
74 Southview St Unit 3rdfl Waterbury, CT 06706
South End District NeighborhoodEstimated Value: $237,000 - $370,000
2
Beds
1
Bath
2,808
Sq Ft
$106/Sq Ft
Est. Value
About This Home
This home is located at 74 Southview St Unit 3rdfl, Waterbury, CT 06706 and is currently estimated at $297,333, approximately $105 per square foot. 74 Southview St Unit 3rdfl is a home located in New Haven County with nearby schools including Washington School, West Side Middle School, and Crosby High School.
Ownership History
Date
Name
Owned For
Owner Type
Purchase Details
Closed on
Jan 5, 2023
Sold by
Ramprasad Ganesh and Ramjohn Bibi S
Bought by
Feder Jacob
Current Estimated Value
Home Financials for this Owner
Home Financials are based on the most recent Mortgage that was taken out on this home.
Original Mortgage
$245,000
Outstanding Balance
$237,395
Interest Rate
6.58%
Mortgage Type
Purchase Money Mortgage
Estimated Equity
$59,938
Purchase Details
Closed on
Jan 5, 2006
Sold by
Duran Hector and Soto Ana
Bought by
Ramprasad Ganesh and Ramjohn Bibi S
Home Financials for this Owner
Home Financials are based on the most recent Mortgage that was taken out on this home.
Original Mortgage
$156,000
Interest Rate
6.28%
Mortgage Type
Purchase Money Mortgage
Create a Home Valuation Report for This Property
The Home Valuation Report is an in-depth analysis detailing your home's value as well as a comparison with similar homes in the area
Home Values in the Area
Average Home Value in this Area
Purchase History
| Date | Buyer | Sale Price | Title Company |
|---|---|---|---|
| Feder Jacob | $190,000 | None Available | |
| Feder Jacob | $190,000 | None Available | |
| Ramprasad Ganesh | $195,000 | -- | |
| Ramprasad Ganesh | $195,000 | -- |
Source: Public Records
Mortgage History
| Date | Status | Borrower | Loan Amount |
|---|---|---|---|
| Open | Feder Jacob | $245,000 | |
| Previous Owner | Ramprasad Ganesh | $156,000 | |
| Previous Owner | Ramprasad Ganesh | $39,000 |
Source: Public Records
Tax History Compared to Growth
Tax History
| Year | Tax Paid | Tax Assessment Tax Assessment Total Assessment is a certain percentage of the fair market value that is determined by local assessors to be the total taxable value of land and additions on the property. | Land | Improvement |
|---|---|---|---|---|
| 2025 | $6,124 | $136,150 | $14,000 | $122,150 |
| 2024 | $6,731 | $136,150 | $14,000 | $122,150 |
| 2023 | $7,378 | $136,150 | $14,000 | $122,150 |
| 2022 | $4,497 | $74,690 | $14,010 | $60,680 |
| 2021 | $4,497 | $74,690 | $14,010 | $60,680 |
| 2020 | $4,497 | $74,690 | $14,010 | $60,680 |
| 2019 | $4,497 | $74,690 | $14,010 | $60,680 |
| 2018 | $4,497 | $74,690 | $14,010 | $60,680 |
| 2017 | $4,670 | $77,560 | $14,000 | $63,560 |
| 2016 | $4,670 | $77,560 | $14,000 | $63,560 |
| 2015 | $4,516 | $77,560 | $14,000 | $63,560 |
| 2014 | $4,516 | $77,560 | $14,000 | $63,560 |
Source: Public Records
Map
Nearby Homes
- 127 Lounsbury St
- 915 S Main St
- 41 Laval St
- 40 Laval St
- 146 Charles St
- 32 Ridge St
- 137 Greenmount Terrace
- 140 Edgewood Ave
- 381 Congress Ave
- 0372 Floyd St
- 41L Floyd St
- 0039 Floyd St
- 318 Congress Ave
- 430 Washington Ave
- 124 Geddes Terrace
- 16 Clairmont Ave
- 571 Wilson St
- 36 Norman St
- 00 Milton Ave
- 439 Piedmont St
- 74 Southview St
- 70 Southview St
- 71 Southview St
- 62 Southview St
- 62 Southview St Unit 2nd Floor
- 79 Southview St
- 69 Lounsbury St
- 69 Lounsbury St Unit 2ND
- 69 Lounsbury St Unit 1ST
- 65 Lounsbury St
- 65 Lounsbury St Unit 3
- 73 Lounsbury St
- 73 Lounsbury St Unit 1
- 73 Lounsbury St Unit 2
- 73 Lounsbury St Unit 3FL
- 73 Lounsbury St Unit 1FL
- 73 Lounsbury St Unit 3RD
- 73 Lounsbury St Unit 1ST
- 73 Lounsbury St Unit 3rd fl
- 61 Lounsbury St