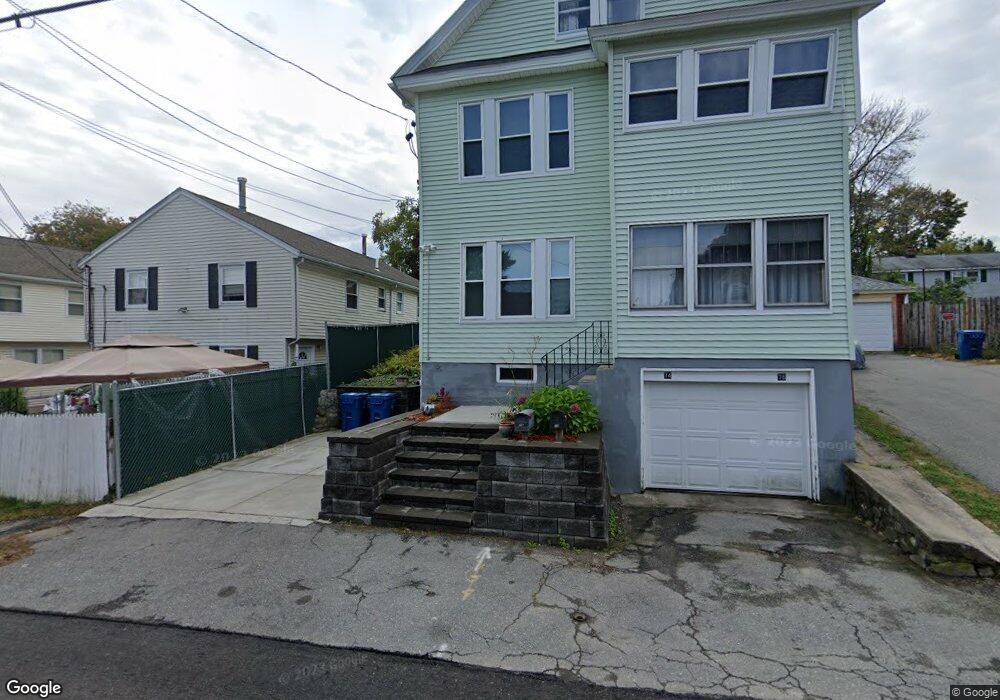
74 Sylvester St Unit 76 Lawrence, MA 01843
Mount Vernon NeighborhoodEstimated Value: $582,000 - $702,000
2
Beds
1
Bath
1,000
Sq Ft
$658/Sq Ft
Est. Value
About This Home
This home is located at 74 Sylvester St Unit 76, Lawrence, MA 01843 and is currently estimated at $657,755, approximately $657 per square foot. 74 Sylvester St Unit 76 is a home located in Essex County with nearby schools including John Breen School, School For Exceptional Studies, and Robert Frost Middle School.
Ownership History
Date
Name
Owned For
Owner Type
Purchase Details
Closed on
Apr 2, 2018
Sold by
Marianne Rheaume Ret
Bought by
Dacosta Fernando M and Dacosta Heather A
Current Estimated Value
Home Financials for this Owner
Home Financials are based on the most recent Mortgage that was taken out on this home.
Original Mortgage
$239,112
Outstanding Balance
$205,918
Interest Rate
4.5%
Mortgage Type
FHA
Estimated Equity
$451,837
Purchase Details
Closed on
Feb 23, 2015
Sold by
Rheaume Marianne
Bought by
Marianne Rheaume Ret
Purchase Details
Closed on
Mar 18, 2002
Sold by
Est Hebert Alfred H and Bill Beverly A
Bought by
Rheaume Marianne
Home Financials for this Owner
Home Financials are based on the most recent Mortgage that was taken out on this home.
Original Mortgage
$125,500
Interest Rate
7.04%
Mortgage Type
Purchase Money Mortgage
Create a Home Valuation Report for This Property
The Home Valuation Report is an in-depth analysis detailing your home's value as well as a comparison with similar homes in the area
Home Values in the Area
Average Home Value in this Area
Purchase History
| Date | Buyer | Sale Price | Title Company |
|---|---|---|---|
| Dacosta Fernando M | $335,000 | -- | |
| Marianne Rheaume Ret | -- | -- | |
| Rheaume Marianne | $139,500 | -- |
Source: Public Records
Mortgage History
| Date | Status | Borrower | Loan Amount |
|---|---|---|---|
| Open | Dacosta Fernando M | $239,112 | |
| Previous Owner | Rheaume Marianne | $116,565 | |
| Previous Owner | Rheaume Marianne | $125,500 |
Source: Public Records
Tax History
| Year | Tax Paid | Tax Assessment Tax Assessment Total Assessment is a certain percentage of the fair market value that is determined by local assessors to be the total taxable value of land and additions on the property. | Land | Improvement |
|---|---|---|---|---|
| 2025 | $5,251 | $596,700 | $134,200 | $462,500 |
| 2024 | $4,817 | $520,800 | $113,300 | $407,500 |
| 2023 | $4,948 | $487,000 | $101,000 | $386,000 |
| 2022 | $4,356 | $380,800 | $93,800 | $287,000 |
| 2021 | $4,232 | $344,900 | $91,600 | $253,300 |
| 2020 | $3,978 | $320,000 | $79,400 | $240,600 |
| 2019 | $3,906 | $285,500 | $79,100 | $206,400 |
| 2018 | $3,672 | $256,400 | $75,600 | $180,800 |
| 2017 | $3,525 | $229,800 | $74,900 | $154,900 |
| 2016 | $3,304 | $213,000 | $69,400 | $143,600 |
| 2015 | $3,068 | $202,900 | $69,400 | $133,500 |
Source: Public Records
Map
Nearby Homes
- 102 Weare St
- 116 Weare St
- 12B Stevens St
- 43 Gorham St
- 10 Dartmouth Rd
- 24 Inman St Unit 4
- 341 S Broadway- Parcel II
- 11 W Hawley St
- 87-87A Brookfield St
- 34 Martingale Ln Unit 34
- 34 Beaconsfield St
- 53 Martingale Ln
- 354 N Main St Unit 204
- 42 York St
- 21 Clubview Dr Unit 21
- 16 Balmoral St Unit 214
- 11 Swan Ln Unit 11
- 31 Garfield St
- 27-29 Dorchester St
- 11 Cambridge St
- 70 Sylvester St Unit 72
- 70-72 Sylvester St
- 80 Sylvester St
- 68 Sylvester St
- 66 Sylvester St
- 68 Sylvester St Unit 1
- 9 Mckenney Cir
- 101 Sylvester St
- 11 Mckenney Cir
- 97 Sylvester St
- 7 Mckenney Cir
- 79 Sylvester St
- 105 Sylvester St
- 64 Sylvester St
- 75 Sylvester St
- 86 Sylvester St
- 84 Gilbert St
- 90 Gilbert St
- 80 Gilbert St
- 8 Mckenney Cir
Your Personal Tour Guide
Ask me questions while you tour the home.