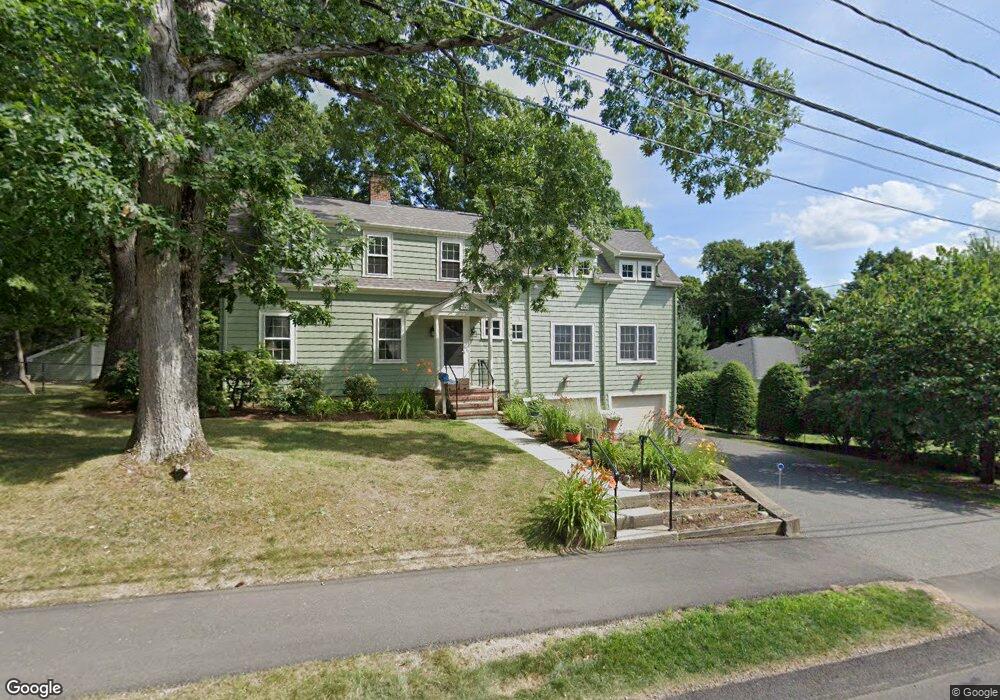
74 Taylor St Needham Heights, MA 02494
Estimated Value: $1,051,000 - $1,557,532
4
Beds
3
Baths
1,536
Sq Ft
$840/Sq Ft
Est. Value
About This Home
This home is located at 74 Taylor St, Needham Heights, MA 02494 and is currently estimated at $1,290,133, approximately $839 per square foot. 74 Taylor St is a home located in Norfolk County with nearby schools including Eliot Elementary School, High Rock Middle School, and Pollard Middle School.
Ownership History
Date
Name
Owned For
Owner Type
Purchase Details
Closed on
Dec 20, 1996
Sold by
Belasco Joel G
Bought by
Macfadden Douglas H
Current Estimated Value
Purchase Details
Closed on
Mar 13, 1987
Sold by
Friswell Archie W
Bought by
Belasco Joel G
Create a Home Valuation Report for This Property
The Home Valuation Report is an in-depth analysis detailing your home's value as well as a comparison with similar homes in the area
Home Values in the Area
Average Home Value in this Area
Purchase History
| Date | Buyer | Sale Price | Title Company |
|---|---|---|---|
| Macfadden Douglas H | $250,000 | -- | |
| Macfadden Douglas H | $250,000 | -- | |
| Belasco Joel G | $210,000 | -- |
Source: Public Records
Mortgage History
| Date | Status | Borrower | Loan Amount |
|---|---|---|---|
| Open | Belasco Joel G | $412,000 | |
| Closed | Belasco Joel G | $35,000 |
Source: Public Records
Tax History
| Year | Tax Paid | Tax Assessment Tax Assessment Total Assessment is a certain percentage of the fair market value that is determined by local assessors to be the total taxable value of land and additions on the property. | Land | Improvement |
|---|---|---|---|---|
| 2025 | $13,127 | $1,238,400 | $769,400 | $469,000 |
| 2024 | $11,331 | $905,000 | $497,800 | $407,200 |
| 2023 | $11,418 | $875,600 | $497,800 | $377,800 |
| 2022 | $10,153 | $759,400 | $446,300 | $313,100 |
| 2021 | $9,895 | $759,400 | $446,300 | $313,100 |
| 2020 | $9,640 | $771,800 | $446,300 | $325,500 |
| 2019 | $9,030 | $728,800 | $407,300 | $321,500 |
| 2018 | $8,658 | $728,800 | $407,300 | $321,500 |
| 2017 | $8,214 | $690,800 | $407,300 | $283,500 |
| 2016 | $7,972 | $690,800 | $407,300 | $283,500 |
| 2015 | $7,799 | $690,800 | $407,300 | $283,500 |
| 2014 | $7,194 | $618,000 | $342,300 | $275,700 |
Source: Public Records
Map
Nearby Homes
- 48 Taylor St
- 70 Briarwood Cir
- 12 Hill St
- 345 Central Ave
- 5 Homsy Ln
- 10 Rosegate Rd
- 10 Fife Rd
- 23 Harvard Cir
- 140 Hillside Ave
- 140 Hillside Ave Unit a
- 379 Hunnewell St Unit 379
- 212 Central Ave
- 132 Hillside Ave
- 134 Hillside Ave Unit 134
- 62 Evelyn Rd
- 36 Eliot Rd
- 3 Crescent Rd
- 34 Pershing Rd
- 81 Parish Rd
- 385 Hillside Ave
Your Personal Tour Guide
Ask me questions while you tour the home.