Estimated Value: $387,789 - $422,000
4
Beds
3
Baths
2,040
Sq Ft
$197/Sq Ft
Est. Value
About This Home
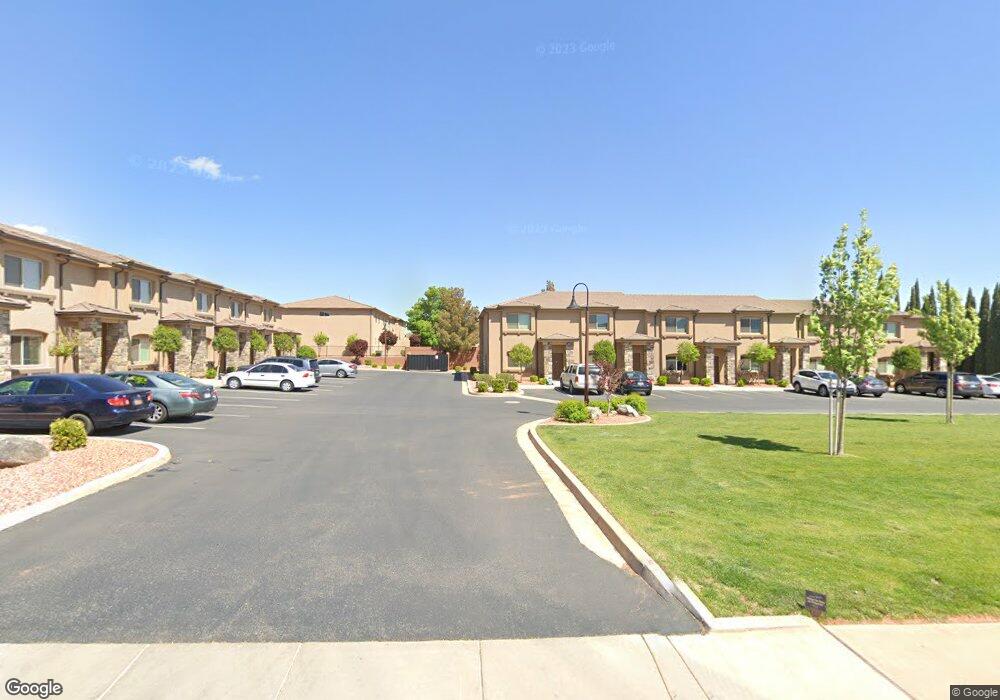
This home is located at 74 W 100 S Unit 1B, Ivins, UT 84738 and is currently estimated at $402,447, approximately $197 per square foot. 74 W 100 S Unit 1B is a home located in Washington County with nearby schools including Snow Canyon Middle School, Lava Ridge Intermediate School, and Snow Canyon High School.
Ownership History
Date
Name
Owned For
Owner Type
Purchase Details
Closed on
Jun 27, 2024
Sold by
Wisneske Loreta Alvarez
Bought by
Wisneske Michael
Current Estimated Value
Purchase Details
Closed on
Oct 13, 2020
Sold by
Wisneske Michael
Bought by
Wisneske Michael and Wisneske Loreta Alvarez
Home Financials for this Owner
Home Financials are based on the most recent Mortgage that was taken out on this home.
Original Mortgage
$232,425
Interest Rate
2.9%
Mortgage Type
New Conventional
Purchase Details
Closed on
Jan 19, 2010
Sold by
Colf Gary A and Colf Rebecca
Bought by
Colf Gary A and Colf Rebecca H
Purchase Details
Closed on
Jan 8, 2010
Sold by
Brinkerhoff Elaine J
Bought by
Colf Gary A and Colf Rebecca
Purchase Details
Closed on
Aug 20, 2008
Sold by
Davidson Randal and Brinkerhoff Elaine J
Bought by
Brinkerhoff Elaine J
Create a Home Valuation Report for This Property
The Home Valuation Report is an in-depth analysis detailing your home's value as well as a comparison with similar homes in the area
Home Values in the Area
Average Home Value in this Area
Purchase History
| Date | Buyer | Sale Price | Title Company |
|---|---|---|---|
| Wisneske Michael | -- | None Listed On Document | |
| Wisneske Michael | -- | Lydolph & Weierholt Ttl Ins | |
| Wisneske Michael | -- | Southern Utah Title Company | |
| Colf Gary A | -- | Accommodation | |
| Colf Gary A | $700,000 | None Available | |
| Brinkerhoff Elaine J | -- | None Available |
Source: Public Records
Mortgage History
| Date | Status | Borrower | Loan Amount |
|---|---|---|---|
| Previous Owner | Wisneske Michael | $232,425 |
Source: Public Records
Tax History Compared to Growth
Tax History
| Year | Tax Paid | Tax Assessment Tax Assessment Total Assessment is a certain percentage of the fair market value that is determined by local assessors to be the total taxable value of land and additions on the property. | Land | Improvement |
|---|---|---|---|---|
| 2025 | $1,321 | $339,500 | $90,000 | $249,500 |
| 2023 | $1,553 | $227,590 | $49,500 | $178,090 |
| 2022 | $1,454 | $200,585 | $49,500 | $151,085 |
| 2021 | $1,509 | $309,300 | $60,000 | $249,300 |
| 2020 | $1,353 | $262,500 | $60,000 | $202,500 |
| 2019 | $1,320 | $250,300 | $60,000 | $190,300 |
| 2018 | $1,412 | $137,830 | $0 | $0 |
| 2017 | $1,278 | $121,385 | $0 | $0 |
| 2016 | $1,277 | $112,035 | $0 | $0 |
| 2015 | $1,229 | $103,785 | $0 | $0 |
| 2014 | $1,159 | $98,340 | $0 | $0 |
Source: Public Records
Map
Nearby Homes
- 45 W Center St Unit 2
- 140 W Center St Unit 20
- 492 S Memory Ln
- 249 S 100 W
- 148 S 200 W
- 262 W 200 S
- 257 S 230 W
- 300 Main St
- 88 N Apex Ln
- 310 N Main St
- 336 W 270 S
- 155 E 200 N
- 704 W Desert Dove Ln
- 716 W Desert Dove Ln
- 692 W Desert Dove Ln
- 692 W Desert Dove Ln Unit (lot 3)
- 744 W Desert Dove Ln
- 744 W Desert Dove Ln Unit (lot 7)
- 339 E 60 S
- 97 S 495 W
- 76 W 100 S Unit 1A
- 72 W 100 S Unit 2A
- 70 W 100 S Unit 2B
- 93 West Ct
- 66 W 100 S Unit 3A
- 64 W 100 S Unit 3B
- 65 W Center St
- 40 W 100 S
- 60 W 100 S
- 60 W 100 S Unit 1 & 2
- 60 W 100 N
- 80 W 100 S
- 45 W Center St Unit 8
- 45 W Center St Unit 7
- 45 W Center St Unit 6
- 45 W Center St Unit 5
- 45 W Center St Unit 4
- 45 W Center St Unit 3
- 45 W Center St Unit 1
- 45 W Center St