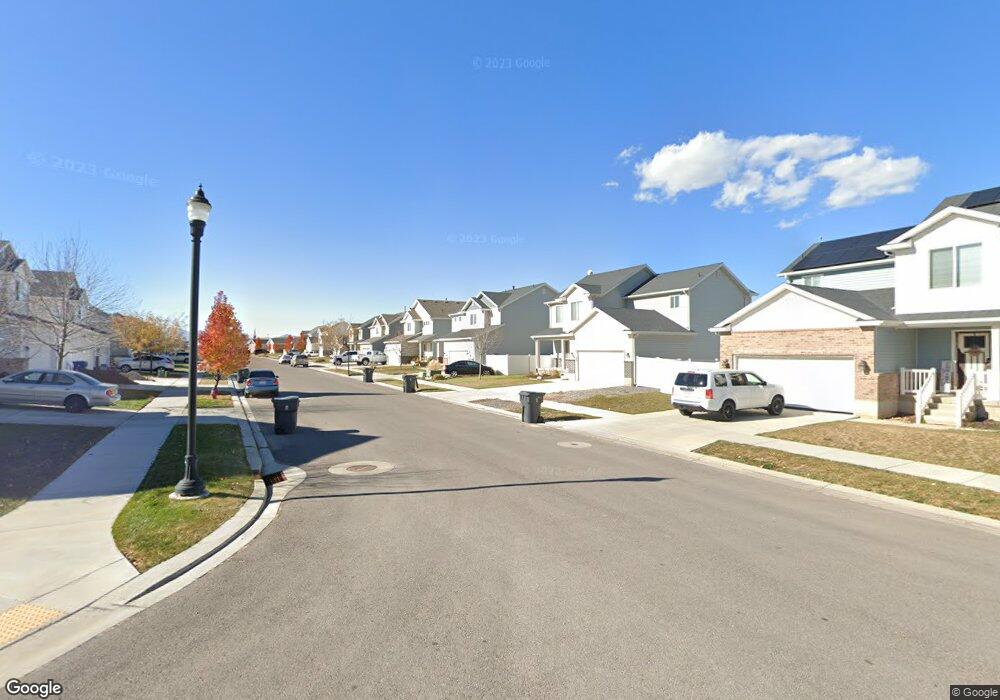
74 W 860 N Santaquin, UT 84655
Estimated Value: $509,647 - $522,000
4
Beds
3
Baths
2,834
Sq Ft
$182/Sq Ft
Est. Value
About This Home
This home is located at 74 W 860 N, Santaquin, UT 84655 and is currently estimated at $514,412, approximately $181 per square foot. 74 W 860 N is a home located in Utah County with nearby schools including Apple Valley Elementary, Payson Junior High School, and Payson High School.
Ownership History
Date
Name
Owned For
Owner Type
Purchase Details
Closed on
Feb 3, 2020
Sold by
Briggs John
Bought by
Briggs John C
Current Estimated Value
Home Financials for this Owner
Home Financials are based on the most recent Mortgage that was taken out on this home.
Original Mortgage
$266,400
Outstanding Balance
$236,503
Interest Rate
3.74%
Mortgage Type
New Conventional
Estimated Equity
$277,909
Purchase Details
Closed on
Dec 19, 2016
Sold by
Sierra Homes Constrution South Llc
Bought by
Briggs John
Home Financials for this Owner
Home Financials are based on the most recent Mortgage that was taken out on this home.
Original Mortgage
$254,759
Interest Rate
3.75%
Mortgage Type
FHA
Purchase Details
Closed on
Jun 28, 2016
Sold by
Blue River Land Group Llc
Bought by
Sierra Homes Construction Soutgh Llc
Create a Home Valuation Report for This Property
The Home Valuation Report is an in-depth analysis detailing your home's value as well as a comparison with similar homes in the area
Home Values in the Area
Average Home Value in this Area
Purchase History
| Date | Buyer | Sale Price | Title Company |
|---|---|---|---|
| Briggs John C | -- | Truly Title Inc Utah | |
| Briggs John | -- | Northern Title Co | |
| Sierra Homes Construction Soutgh Llc | -- | American Secure Title Tremon |
Source: Public Records
Mortgage History
| Date | Status | Borrower | Loan Amount |
|---|---|---|---|
| Open | Briggs John C | $266,400 | |
| Closed | Briggs John | $254,759 |
Source: Public Records
Tax History Compared to Growth
Tax History
| Year | Tax Paid | Tax Assessment Tax Assessment Total Assessment is a certain percentage of the fair market value that is determined by local assessors to be the total taxable value of land and additions on the property. | Land | Improvement |
|---|---|---|---|---|
| 2025 | $2,162 | $243,210 | $125,300 | $316,900 |
| 2024 | $2,162 | $215,325 | $0 | $0 |
| 2023 | $2,267 | $226,435 | $0 | $0 |
| 2022 | $2,339 | $241,010 | $0 | $0 |
| 2021 | $2,037 | $325,400 | $70,600 | $254,800 |
| 2020 | $1,965 | $304,100 | $61,400 | $242,700 |
| 2019 | $1,721 | $272,400 | $61,400 | $211,000 |
| 2018 | $1,586 | $239,300 | $53,700 | $185,600 |
| 2017 | $1,553 | $125,235 | $0 | $0 |
| 2016 | $466 | $36,800 | $0 | $0 |
Source: Public Records
Map
Nearby Homes
- 894 N Apple Seed Ln
- 109 W 930 N
- 1032 N Apple Seed Ln
- 951 N 215 W
- 949 N 215 W
- 947 N 215 W
- 953 N 215 W
- McIntosh Plan at The Orchards
- Honey Plan at The Orchards
- Cranford Plan at The Orchards
- Monroe Plan at The Orchards
- Benson Plan at The Orchards
- Gala Plan at The Orchards
- 931 N 215 W
- 41 W 770 N
- 961 N 120 E
- 116 E 840 N
- 162 W 690 N
- Pine Plan at Stratton Acres
- Willow Plan at Stratton Acres