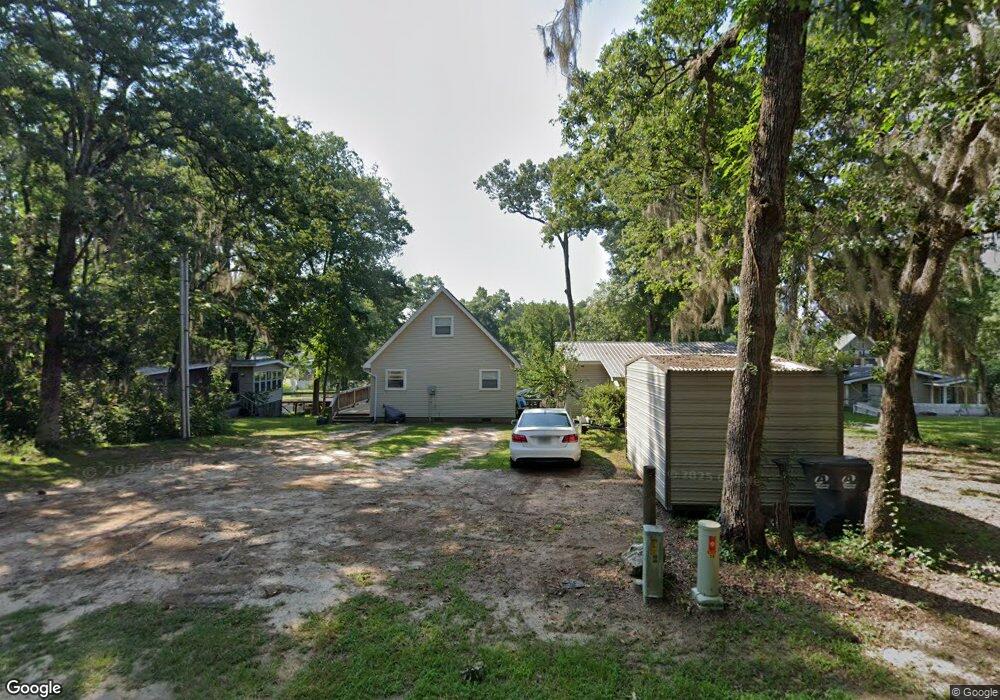
740 Cork Ferry Rd Cordele, GA 31015
Estimated Value: $313,678 - $463,000
2
Beds
2
Baths
1,296
Sq Ft
$324/Sq Ft
Est. Value
About This Home
This home is located at 740 Cork Ferry Rd, Cordele, GA 31015 and is currently estimated at $419,920, approximately $324 per square foot. 740 Cork Ferry Rd is a home located in Crisp County with nearby schools including Crisp County Elementary School, Crisp County Primary School, and Crisp County Middle School.
Ownership History
Date
Name
Owned For
Owner Type
Purchase Details
Closed on
Jul 15, 2021
Sold by
Triple H Famly Holdings Lllp
Bought by
Hamblen Douglas A and Hamblen Kimberly J
Current Estimated Value
Home Financials for this Owner
Home Financials are based on the most recent Mortgage that was taken out on this home.
Original Mortgage
$180,800
Outstanding Balance
$134,225
Interest Rate
2.93%
Mortgage Type
New Conventional
Estimated Equity
$285,695
Purchase Details
Closed on
Dec 28, 2012
Sold by
Holcomb Stephan F
Bought by
Triple H Fam Holdings Lllp
Purchase Details
Closed on
Jul 7, 2003
Sold by
Holcomb Stephan F
Bought by
Holcomb Robin
Purchase Details
Closed on
Sep 11, 1998
Sold by
Scott James W
Bought by
Holcomb Stephan F
Purchase Details
Closed on
May 15, 1989
Sold by
Matt J W
Bought by
Scott James W
Purchase Details
Closed on
Apr 16, 1988
Sold by
Lupo Jerrry
Bought by
Matt J W
Purchase Details
Closed on
Jun 22, 1977
Bought by
Lupo Jerrry
Create a Home Valuation Report for This Property
The Home Valuation Report is an in-depth analysis detailing your home's value as well as a comparison with similar homes in the area
Home Values in the Area
Average Home Value in this Area
Purchase History
| Date | Buyer | Sale Price | Title Company |
|---|---|---|---|
| Hamblen Douglas A | $226,000 | -- | |
| Triple H Fam Holdings Lllp | -- | -- | |
| Holcomb Stephan F | -- | -- | |
| Holcomb Robin | -- | -- | |
| Holcomb Stephan F | $27,000 | -- | |
| Scott James W | $7,500 | -- | |
| Matt J W | $23,000 | -- | |
| Lupo Jerrry | $16,000 | -- |
Source: Public Records
Mortgage History
| Date | Status | Borrower | Loan Amount |
|---|---|---|---|
| Open | Hamblen Douglas A | $180,800 |
Source: Public Records
Tax History Compared to Growth
Tax History
| Year | Tax Paid | Tax Assessment Tax Assessment Total Assessment is a certain percentage of the fair market value that is determined by local assessors to be the total taxable value of land and additions on the property. | Land | Improvement |
|---|---|---|---|---|
| 2025 | $3,603 | $142,838 | $47,622 | $95,216 |
| 2024 | $3,603 | $133,076 | $47,622 | $85,454 |
| 2023 | $3,099 | $110,354 | $47,622 | $62,732 |
| 2022 | $2,727 | $97,088 | $38,098 | $58,990 |
| 2021 | $2,043 | $68,897 | $22,859 | $46,038 |
| 2020 | $2,046 | $68,897 | $22,859 | $46,038 |
| 2019 | $2,033 | $68,897 | $22,859 | $46,038 |
| 2018 | $1,899 | $62,024 | $13,198 | $48,826 |
| 2017 | $1,907 | $62,024 | $13,198 | $48,826 |
| 2016 | $1,905 | $62,024 | $13,198 | $48,826 |
| 2015 | -- | $62,024 | $13,198 | $48,826 |
| 2014 | -- | $62,024 | $13,198 | $48,826 |
| 2013 | -- | $62,023 | $13,198 | $48,825 |
Source: Public Records
Map
Nearby Homes
- 738 Cork Ferry Rd
- 696 Cork Ferry Rd
- 616 Cork Ferry Rd
- 119 Wolfs Thick Rd
- 484 Lakeshore Way
- 629 Cork Ferry Rd
- 228 Cedar Point Cir
- 199 Hurt Dr
- 120 Cove Rd
- 0 Swift Creek Rd Unit 138425
- 1617 Antioch Rd
- 118 Swift Creek Rd
- 0 Arabi Warwick Rd
- 144 Bryant Rd
- 102 Perch Dr
- 000 Bream Rd
- 198 Swift Creek Rd
- 475 N Cedar Creek Rd
- 234 Swift Creek Rd
- 251 N Cedar Creek Rd
- 742 Cork Ferry Rd
- 736 Cork Ferry Rd
- 734 Cork Ferry Rd
- 746 Cork Ferry Rd
- 741 Cork Ferry Rd
- 735 Cork Ferry Rd
- 745 Cork Ferry Rd
- 730 Cork Ferry Rd
- 731 Cork Ferry Rd
- 728 Cork Ferry Rd
- 254 Lakeshore Way
- 260 Lakeshore Way
- 264 Lakeshore Way
- 727 Cork Ferry Rd
- 720 Cork Ferry Rd
- 270 Lakeshore Way
- 723 Cork Ferry Rd
- 716 Cork Ferry Rd
- 257 Lakeshore Way
- 257 Lakeshore Way