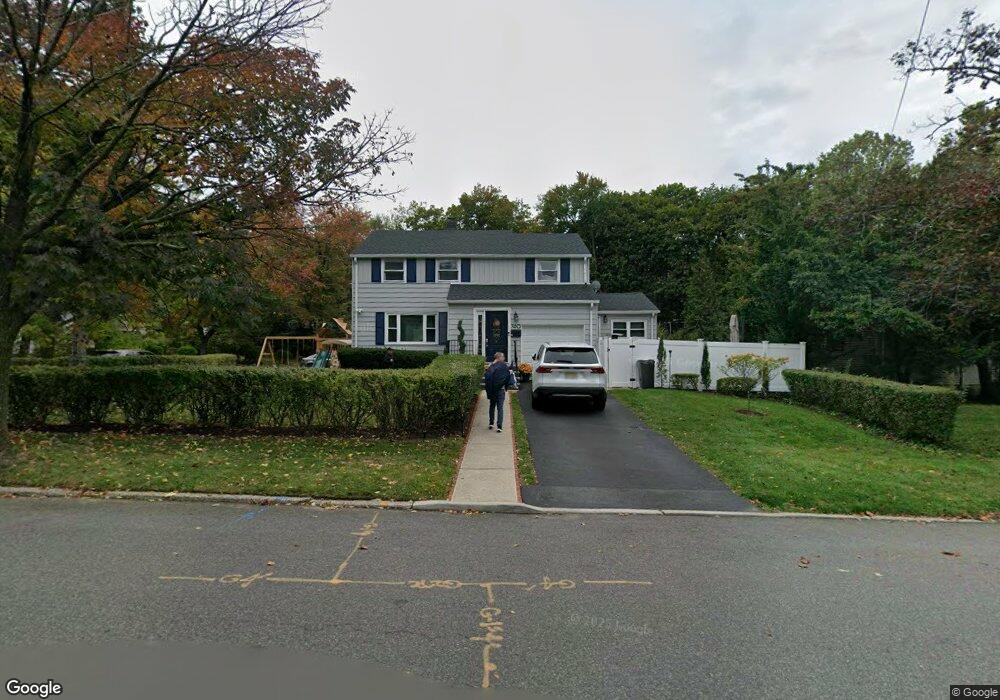
740 Cornwall Ave Teaneck, NJ 07666
Estimated Value: $722,000 - $739,502
4
Beds
2
Baths
1,820
Sq Ft
$400/Sq Ft
Est. Value
About This Home
This home is located at 740 Cornwall Ave, Teaneck, NJ 07666 and is currently estimated at $728,376, approximately $400 per square foot. 740 Cornwall Ave is a home located in Bergen County with nearby schools including Teaneck Senior High School, Teaneck Community Charter School, and Grace Lutheran School.
Ownership History
Date
Name
Owned For
Owner Type
Purchase Details
Closed on
Nov 25, 2019
Sold by
Acevedo Jasen and Acevedo Neliana
Bought by
Lopez Jose Rafael and Lopez Marlene
Current Estimated Value
Home Financials for this Owner
Home Financials are based on the most recent Mortgage that was taken out on this home.
Original Mortgage
$412,250
Interest Rate
3.6%
Mortgage Type
New Conventional
Purchase Details
Closed on
Dec 31, 2013
Sold by
Johnson Gina and Stevens Terry
Bought by
Acevedo Jasen and Acevedo Neliana
Purchase Details
Closed on
Nov 4, 2008
Sold by
Gmac Mortgage Llc
Bought by
Hud
Purchase Details
Closed on
Aug 18, 2008
Sold by
Mcguire Leo P
Bought by
Secretary Of Hud
Purchase Details
Closed on
May 30, 2006
Sold by
Koretsky William A
Bought by
Kinard Sybil and Hope Warren
Home Financials for this Owner
Home Financials are based on the most recent Mortgage that was taken out on this home.
Original Mortgage
$368,231
Interest Rate
6.55%
Purchase Details
Closed on
May 26, 2006
Sold by
Koretsky William A
Bought by
Kinard Sybil and Hope Warren
Home Financials for this Owner
Home Financials are based on the most recent Mortgage that was taken out on this home.
Original Mortgage
$368,231
Interest Rate
6.55%
Purchase Details
Closed on
Jan 1, 1999
Sold by
Koretsky William W and Koretsky Joan E
Bought by
Koretsky William A
Create a Home Valuation Report for This Property
The Home Valuation Report is an in-depth analysis detailing your home's value as well as a comparison with similar homes in the area
Home Values in the Area
Average Home Value in this Area
Purchase History
| Date | Buyer | Sale Price | Title Company |
|---|---|---|---|
| Lopez Jose Rafael | $425,000 | Cb Title Group Llc | |
| Acevedo Jasen | $305,000 | -- | |
| Hud | -- | -- | |
| Gmac Mortgage Llc | -- | -- | |
| Secretary Of Hud | $412,974 | -- | |
| Kinard Sybil | $425,000 | -- | |
| Kinard Sybil | $425,000 | -- | |
| Koretsky William A | $166,000 | -- |
Source: Public Records
Mortgage History
| Date | Status | Borrower | Loan Amount |
|---|---|---|---|
| Previous Owner | Lopez Jose Rafael | $412,250 | |
| Previous Owner | Kinard Sybil | $368,231 |
Source: Public Records
Tax History
| Year | Tax Paid | Tax Assessment Tax Assessment Total Assessment is a certain percentage of the fair market value that is determined by local assessors to be the total taxable value of land and additions on the property. | Land | Improvement |
|---|---|---|---|---|
| 2025 | $13,307 | $609,300 | $337,900 | $271,400 |
| 2024 | $12,617 | $609,300 | $337,900 | $271,400 |
| 2023 | $12,369 | $382,100 | $205,000 | $177,100 |
| 2022 | $12,369 | $382,100 | $205,000 | $177,100 |
| 2021 | $12,441 | $382,100 | $205,000 | $177,100 |
| 2020 | $12,357 | $382,100 | $205,000 | $177,100 |
| 2019 | $12,216 | $382,100 | $205,000 | $177,100 |
| 2018 | $12,124 | $382,100 | $205,000 | $177,100 |
| 2017 | $12,009 | $382,100 | $205,000 | $177,100 |
| 2016 | $11,830 | $382,100 | $205,000 | $177,100 |
| 2015 | $11,643 | $382,100 | $205,000 | $177,100 |
| 2014 | $8,356 | $325,000 | $304,000 | $21,000 |
Source: Public Records
Map
Nearby Homes
- 654 Suffern Rd
- 700 Ramapo Rd
- 624 Ramapo Rd
- 711 Camperdown Rd
- 633 Wilmerding Ave
- 506 Sunderland Rd
- 1284 Wellington Ave
- 593 Beverly Rd
- 940 Garrison Ave
- 995 Grace Terrace
- 489 Maple Ave
- 649 Ogden Ave
- 1105 Belle Ave
- 364 Billington Rd
- 1500 River Rd
- 857 Garrison Ave
- 735 Elm Ave Unit 5F
- 539 Kenwood Place
- 532 Winthrop Rd
- 31 Fairmount Ave Unit 16A
- 1120 Tunbridge Rd
- 750 Cornwall Ave
- 743 Cornwall Ave
- 1114 Tunbridge Rd
- 726 Cornwall Ave
- 1123 River Rd
- 733 Cornwall Ave
- 1153 River Rd
- 1121 Tunbridge Rd
- 720 Cornwall Ave
- 727 Cornwall Ave
- 1113 Tunbridge Rd
- 723 Cornwall Ave
- 1159 River Rd
- 714 Cornwall Ave
- 717 Cornwall Ave
- 1118 Falmouth Ave
- 726 Northumberland Rd
- 1165 River Rd
- 692 Cornwall Ave
Your Personal Tour Guide
Ask me questions while you tour the home.