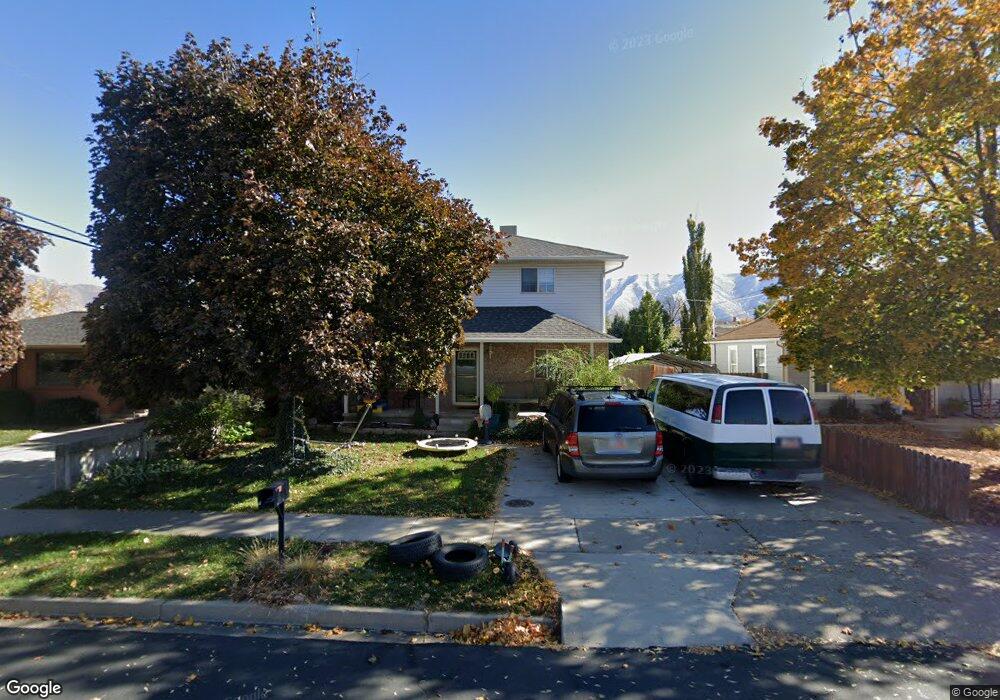
740 N 100 E Spanish Fork, UT 84660
Estimated Value: $492,000 - $543,185
6
Beds
3
Baths
3,280
Sq Ft
$158/Sq Ft
Est. Value
About This Home
This home is located at 740 N 100 E, Spanish Fork, UT 84660 and is currently estimated at $519,728, approximately $158 per square foot. 740 N 100 E is a home located in Utah County with nearby schools including Park Elementary School, Spanish Fork Jr High School, and Spanish Fork High School.
Ownership History
Date
Name
Owned For
Owner Type
Purchase Details
Closed on
Oct 14, 2015
Sold by
Donaldson Marlo H and Chappel Marlo H
Bought by
Chappel James M
Current Estimated Value
Purchase Details
Closed on
Oct 6, 2003
Sold by
Chappel James M
Bought by
Chappel James M and Chappel Marlo H
Home Financials for this Owner
Home Financials are based on the most recent Mortgage that was taken out on this home.
Original Mortgage
$135,500
Interest Rate
6.27%
Mortgage Type
Purchase Money Mortgage
Purchase Details
Closed on
Aug 26, 1998
Sold by
Chappel Colleen M and Chappel James M
Bought by
Chappel James M
Home Financials for this Owner
Home Financials are based on the most recent Mortgage that was taken out on this home.
Original Mortgage
$125,000
Interest Rate
6.91%
Create a Home Valuation Report for This Property
The Home Valuation Report is an in-depth analysis detailing your home's value as well as a comparison with similar homes in the area
Home Values in the Area
Average Home Value in this Area
Purchase History
| Date | Buyer | Sale Price | Title Company |
|---|---|---|---|
| Chappel James M | -- | Pro Title & Escrow Inc | |
| Chappel James M | -- | Pro Title & Escrow Inc | |
| Chappel James M | -- | -- |
Source: Public Records
Mortgage History
| Date | Status | Borrower | Loan Amount |
|---|---|---|---|
| Previous Owner | Chappel James M | $135,500 | |
| Previous Owner | Chappel James M | $125,000 | |
| Closed | Chappel James M | $12,500 |
Source: Public Records
Tax History
| Year | Tax Paid | Tax Assessment Tax Assessment Total Assessment is a certain percentage of the fair market value that is determined by local assessors to be the total taxable value of land and additions on the property. | Land | Improvement |
|---|---|---|---|---|
| 2025 | $2,184 | $257,070 | -- | -- |
| 2024 | $2,184 | $225,115 | $0 | $0 |
| 2023 | $2,198 | $226,820 | $0 | $0 |
| 2022 | $2,310 | $233,750 | $0 | $0 |
| 2021 | $2,075 | $335,900 | $77,900 | $258,000 |
| 2020 | $1,889 | $297,300 | $64,900 | $232,400 |
| 2019 | $1,612 | $267,000 | $64,900 | $202,100 |
| 2018 | $1,503 | $240,600 | $64,900 | $175,700 |
| 2017 | $1,358 | $116,820 | $0 | $0 |
| 2016 | $1,270 | $107,855 | $0 | $0 |
| 2015 | $1,146 | $96,140 | $0 | $0 |
| 2014 | $1,037 | $87,285 | $0 | $0 |
Source: Public Records
Map
Nearby Homes
Your Personal Tour Guide
Ask me questions while you tour the home.