740 N Main St Mantua, UT 84324
Estimated Value: $965,000 - $1,200,337
--
Bed
--
Bath
2,499
Sq Ft
$418/Sq Ft
Est. Value
About This Home
This home is located at 740 N Main St, Mantua, UT 84324 and is currently estimated at $1,044,446, approximately $417 per square foot. 740 N Main St is a home located in Box Elder County with nearby schools including Golden Spike Elementary, Box Elder Middle School, and Adele C. Young Intermediate School.
Create a Home Valuation Report for This Property
The Home Valuation Report is an in-depth analysis detailing your home's value as well as a comparison with similar homes in the area
Home Values in the Area
Average Home Value in this Area
Tax History Compared to Growth
Tax History
| Year | Tax Paid | Tax Assessment Tax Assessment Total Assessment is a certain percentage of the fair market value that is determined by local assessors to be the total taxable value of land and additions on the property. | Land | Improvement |
|---|---|---|---|---|
| 2025 | $4,176 | $1,096,180 | $251,200 | $844,980 |
| 2024 | $3,678 | $661,090 | $226,200 | $434,890 |
| 2023 | $3,915 | $726,536 | $226,200 | $500,336 |
| 2022 | $3,277 | $557,970 | $109,200 | $448,770 |
| 2021 | $3,006 | $411,935 | $109,200 | $302,735 |
| 2020 | $2,934 | $411,935 | $109,200 | $302,735 |
| 2019 | $2,796 | $23,400 | $11,700 | $11,700 |
| 2018 | $2,116 | $152,383 | $41,400 | $110,983 |
| 2017 | $2,178 | $267,487 | $41,400 | $201,787 |
| 2016 | $2,162 | $147,098 | $41,400 | $105,698 |
| 2015 | $1,908 | $132,029 | $35,940 | $96,089 |
| 2014 | $1,908 | $127,453 | $35,940 | $91,513 |
| 2013 | -- | $127,435 | $16,500 | $110,935 |
Source: Public Records
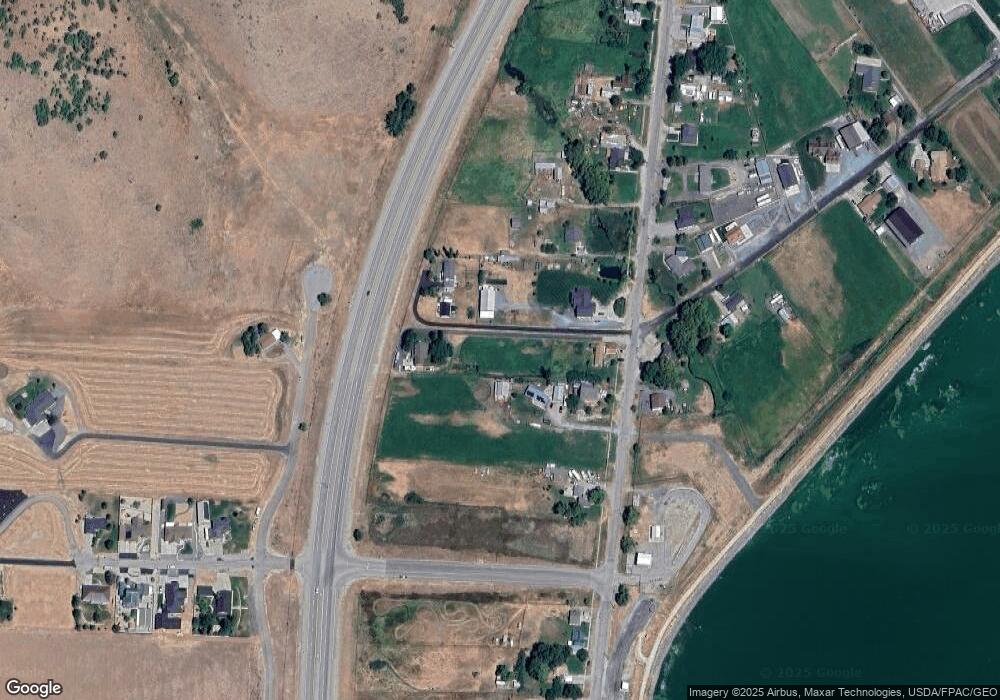
Map
Nearby Homes
- 115 S Main St
- 91 U S 89
- 263 E Fish Hatchery Rd
- 270 E Mountain View Dr Unit 59
- 534 E Fish Hatchery Rd
- 159 E 625 S
- 655 Willard Peak Rd
- 1623 Willard Peak Rd Unit 1
- 1705 Willard Peak Rd Unit 2
- 1329 E Kaylynne Cir
- 64 N Bywater Way
- 192 N Highland Blvd
- 1066 Beecher Ave
- 1102 Carolyn Place
- 1048 Elm Ave
- 510 Aspen Dr
- 948 E 300 N
- 281 N 900 E
- 770 E 350 S
- 812 E 400 N