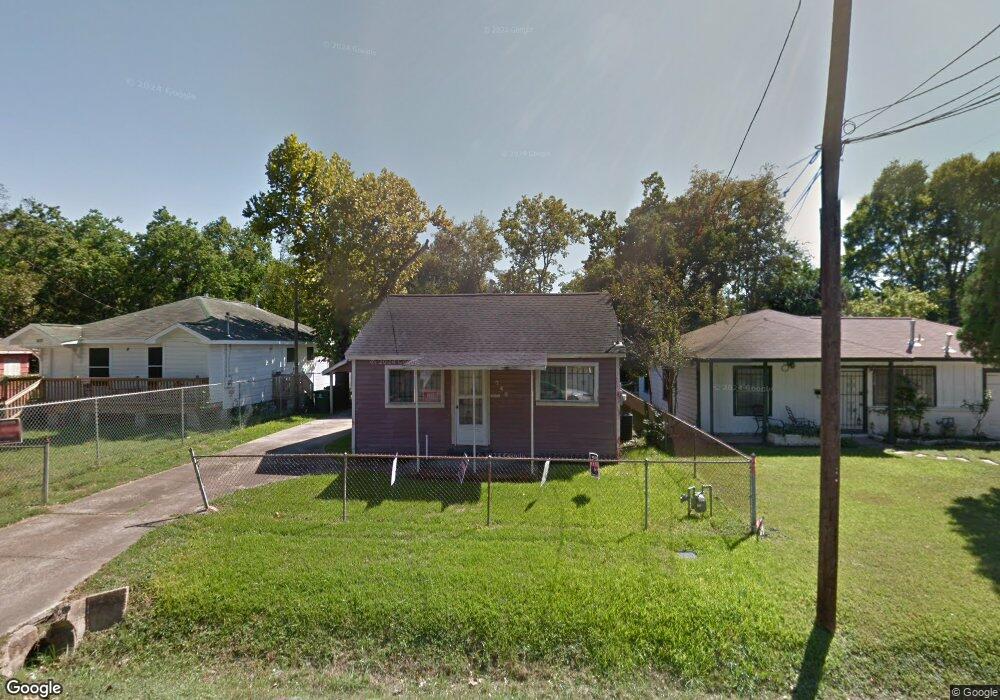
740 Neyland St Houston, TX 77022
Independence Heights NeighborhoodEstimated Value: $307,000 - $331,000
3
Beds
2
Baths
1,480
Sq Ft
$219/Sq Ft
Est. Value
About This Home
This home is located at 740 Neyland St, Houston, TX 77022 and is currently estimated at $323,494, approximately $218 per square foot. 740 Neyland St is a home located in Harris County with nearby schools including Kennedy Elementary School, Williams Middle, and Booker T Washington Sr High.
Ownership History
Date
Name
Owned For
Owner Type
Purchase Details
Closed on
Jun 19, 2020
Sold by
Gaines Zerina M
Bought by
Gaines Zerina M
Current Estimated Value
Home Financials for this Owner
Home Financials are based on the most recent Mortgage that was taken out on this home.
Original Mortgage
$415,500
Interest Rate
3.27%
Mortgage Type
Reverse Mortgage Home Equity Conversion Mortgage
Create a Home Valuation Report for This Property
The Home Valuation Report is an in-depth analysis detailing your home's value as well as a comparison with similar homes in the area
Home Values in the Area
Average Home Value in this Area
Purchase History
| Date | Buyer | Sale Price | Title Company |
|---|---|---|---|
| Gaines Zerina M | -- | Fnc Title Services Llc |
Source: Public Records
Mortgage History
| Date | Status | Borrower | Loan Amount |
|---|---|---|---|
| Closed | Gaines Zerina M | $415,500 |
Source: Public Records
Tax History Compared to Growth
Tax History
| Year | Tax Paid | Tax Assessment Tax Assessment Total Assessment is a certain percentage of the fair market value that is determined by local assessors to be the total taxable value of land and additions on the property. | Land | Improvement |
|---|---|---|---|---|
| 2025 | $725 | $381,134 | $145,800 | $235,334 |
| 2024 | $725 | $369,214 | $145,800 | $223,414 |
| 2023 | $725 | $339,948 | $129,600 | $210,348 |
| 2022 | $6,929 | $322,694 | $129,600 | $193,094 |
| 2021 | $6,668 | $286,093 | $102,600 | $183,493 |
| 2020 | $6,313 | $261,003 | $97,200 | $163,803 |
| 2019 | $5,997 | $237,000 | $48,600 | $188,400 |
| 2018 | $2,239 | $248,690 | $48,600 | $200,090 |
| 2017 | $5,757 | $234,511 | $32,400 | $202,111 |
| 2016 | $1,285 | $52,591 | $21,600 | $30,991 |
| 2015 | $688 | $52,591 | $21,600 | $30,991 |
| 2014 | $688 | $42,000 | $14,850 | $27,150 |
Source: Public Records
Map
Nearby Homes
- 821 Neyland St
- 821 Barkley St
- 4303 Castor St
- 4303 Castor Na St
- 4208 Castor St Unit B
- 4208 Castor St Unit A
- 4303 Cadmus St
- 4305 Castor St
- 4206 Oxford St
- 603 Neyland
- 4109 Castor St Unit B
- 4309 Delhi St
- 4220 Delhi St
- 515 E 43rd St
- 508 Neyland St
- 4302 Delhi St
- 606 E 42nd St
- 4311 Europa St
- 436 Neyland St Unit 1
- 431 Neyland St