740 S Main St Brigham City, UT 84302
--
Bed
--
Bath
5,950
Sq Ft
1.5
Acres
About This Home
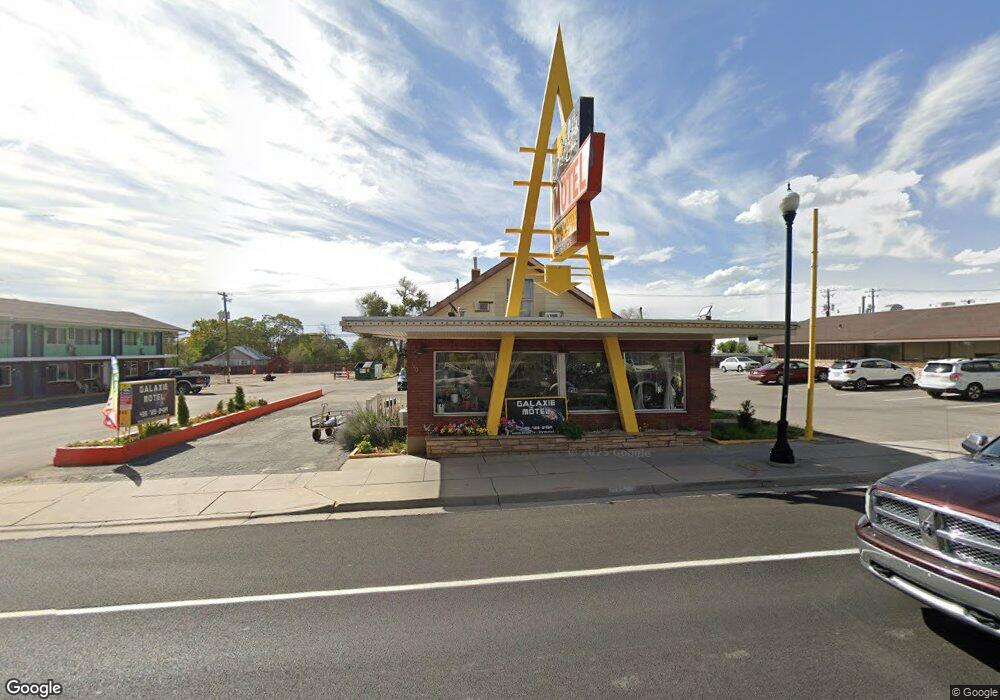
This home is located at 740 S Main St, Brigham City, UT 84302. 740 S Main St is a home located in Box Elder County with nearby schools including Lake View Elementary School, Adele C. Young Intermediate School, and Box Elder Middle School.
Ownership History
Date
Name
Owned For
Owner Type
Purchase Details
Closed on
Feb 6, 2013
Sold by
Khodal Llc
Bought by
Ahir Bc Llc
Purchase Details
Closed on
May 18, 2012
Sold by
Ahir Manoj Ramu
Bought by
Khodal Llc
Purchase Details
Closed on
Jun 27, 2008
Sold by
Bess Realty Inc
Bought by
Ahir Manoj Ramu
Home Financials for this Owner
Home Financials are based on the most recent Mortgage that was taken out on this home.
Original Mortgage
$600,000
Interest Rate
6%
Mortgage Type
Unknown
Create a Home Valuation Report for This Property
The Home Valuation Report is an in-depth analysis detailing your home's value as well as a comparison with similar homes in the area
Home Values in the Area
Average Home Value in this Area
Purchase History
| Date | Buyer | Sale Price | Title Company |
|---|---|---|---|
| Ahir Bc Llc | -- | None Available | |
| Khodal Llc | -- | None Available | |
| Ahir Manoj Ramu | -- | None Available |
Source: Public Records
Mortgage History
| Date | Status | Borrower | Loan Amount |
|---|---|---|---|
| Previous Owner | Ahir Manoj Ramu | $600,000 |
Source: Public Records
Tax History Compared to Growth
Tax History
| Year | Tax Paid | Tax Assessment Tax Assessment Total Assessment is a certain percentage of the fair market value that is determined by local assessors to be the total taxable value of land and additions on the property. | Land | Improvement |
|---|---|---|---|---|
| 2025 | $11,004 | $2,093,060 | $392,040 | $1,701,020 |
| 2024 | $11,004 | $1,165,231 | $392,040 | $773,191 |
| 2023 | $10,748 | $1,165,231 | $392,040 | $773,191 |
| 2022 | $5,830 | $587,541 | $326,700 | $260,841 |
| 2021 | $6,402 | $587,541 | $326,700 | $260,841 |
| 2020 | $6,575 | $587,541 | $326,700 | $260,841 |
| 2019 | $6,796 | $587,541 | $326,700 | $260,841 |
| 2018 | $6,835 | $587,541 | $326,700 | $260,841 |
| 2017 | $3,868 | $316,600 | $54,500 | $262,100 |
| 2016 | $4,207 | $316,600 | $54,500 | $262,100 |
| 2015 | $4,368 | $316,600 | $54,500 | $262,100 |
| 2014 | $4,368 | $316,600 | $54,500 | $262,100 |
| 2013 | -- | $316,600 | $54,500 | $262,100 |
Source: Public Records
Map
Nearby Homes