Estimated Value: $451,000 - $485,895
3
Beds
1
Bath
1,278
Sq Ft
$365/Sq Ft
Est. Value
About This Home
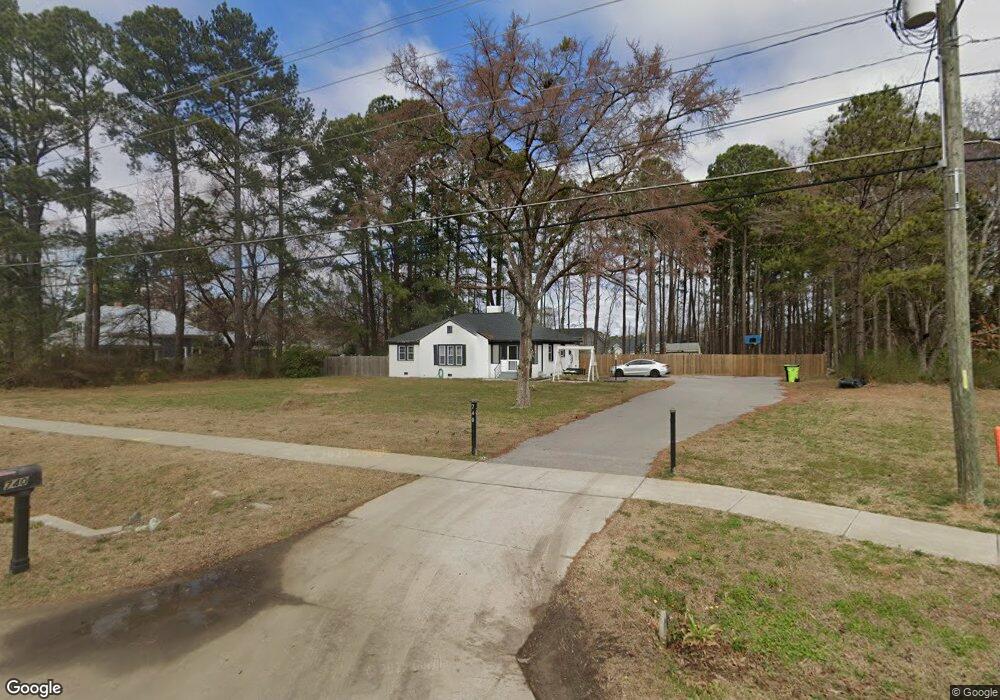
This home is located at 740 S Salem St, Apex, NC 27502 and is currently estimated at $466,224, approximately $364 per square foot. 740 S Salem St is a home located in Wake County with nearby schools including Baucom Elementary School, Apex Middle, and Apex High School.
Ownership History
Date
Name
Owned For
Owner Type
Purchase Details
Closed on
Jul 10, 2024
Sold by
Mckinnish Lori
Bought by
Mckinnish Family Trust and Mckinnish
Current Estimated Value
Purchase Details
Closed on
Sep 16, 2016
Sold by
Miller Jennifer L and Miller Michael F
Bought by
Mckinnish Lori
Purchase Details
Closed on
Dec 22, 2005
Sold by
Harrington Gerald L and Harrington Lois G
Bought by
Miller Michael F and Miller Jennifer L
Home Financials for this Owner
Home Financials are based on the most recent Mortgage that was taken out on this home.
Original Mortgage
$212,000
Interest Rate
5.5%
Mortgage Type
Fannie Mae Freddie Mac
Purchase Details
Closed on
May 20, 1999
Sold by
Tunstall Warren T and Tunstall Retha L
Bought by
Harrington Gerald L and Harrington Lois G
Home Financials for this Owner
Home Financials are based on the most recent Mortgage that was taken out on this home.
Original Mortgage
$106,550
Interest Rate
6.84%
Create a Home Valuation Report for This Property
The Home Valuation Report is an in-depth analysis detailing your home's value as well as a comparison with similar homes in the area
Purchase History
| Date | Buyer | Sale Price | Title Company |
|---|---|---|---|
| Mckinnish Family Trust | -- | None Listed On Document | |
| Mckinnish Lori | $252,000 | None Available | |
| Miller Michael F | $265,000 | None Available | |
| Harrington Gerald L | $112,500 | -- |
Source: Public Records
Mortgage History
| Date | Status | Borrower | Loan Amount |
|---|---|---|---|
| Previous Owner | Miller Michael F | $212,000 | |
| Previous Owner | Harrington Gerald L | $106,550 |
Source: Public Records
Tax History
| Year | Tax Paid | Tax Assessment Tax Assessment Total Assessment is a certain percentage of the fair market value that is determined by local assessors to be the total taxable value of land and additions on the property. | Land | Improvement |
|---|---|---|---|---|
| 2025 | $3,923 | $447,067 | $381,150 | $65,917 |
| 2024 | $3,836 | $447,067 | $381,150 | $65,917 |
Source: Public Records
Map
Nearby Homes
- 1434 Salem Creek Dr
- 203 Milky Way Dr
- 102 Licorice Dr
- 120 Licorice Dr
- 111 Lemon Drop Cir
- 1008 Daresbury Dr
- 406 S Salem St
- 0-2932 Tingen Rd
- 1108 Elbury Dr
- 110 Anterbury Dr
- 1306 Grappenhall Dr
- 307 S Elm St
- 1039 Dual Parks Rd
- 1787 Flint Valley Ln
- 352 Anterbury Dr
- 1639 Padstone Dr
- 0 Jb Morgan Rd Unit 10051948
- 359 Anterbury Dr
- 1840 Flint Valley Ln
- 1939 Mostyn Ln
- 800 S Salem St
- 1401 Chipping Dr
- 1401 Chipping Dr Unit 37
- 1403 Chipping Dr
- 1403 Chipping Dr Unit 36
- 720 S Salem St
- 1405 Chipping Dr Unit 35
- 1620 Gopher Ln Unit 37
- 1620 Topaz Ln Unit 37
- 1620 Topaz Ln
- 1409 Chipping Dr
- 1409 Chipping Dr Unit 38
- 1618 Gopher Ln Unit 36
- 1618 Topaz Ln Unit 36
- 1411 Chipping Dr Unit 39
- 1616 Gopher Ln Unit 35
- 1616 Topaz Ln Unit 35
- 1616 Topaz Ln
- 1614 Gopher Ln Unit 34
- 1614 Topaz Ln Unit 34
Your Personal Tour Guide
Ask me questions while you tour the home.