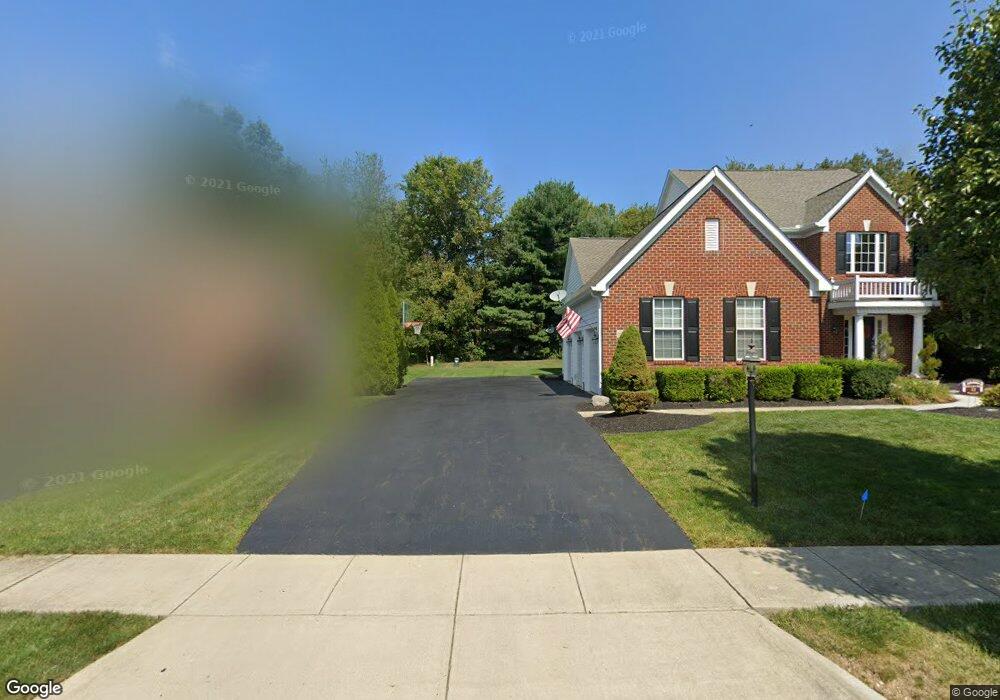
7400 Bevelhymer Rd New Albany, OH 43054
Estimated Value: $704,000 - $1,014,538
4
Beds
3
Baths
3,162
Sq Ft
$268/Sq Ft
Est. Value
About This Home
This home is located at 7400 Bevelhymer Rd, New Albany, OH 43054 and is currently estimated at $846,385, approximately $267 per square foot. 7400 Bevelhymer Rd is a home located in Franklin County with nearby schools including New Albany Primary School, New Albany Intermediate School, and New Albany Middle School.
Ownership History
Date
Name
Owned For
Owner Type
Purchase Details
Closed on
Apr 3, 2012
Sold by
Stribick George R and Stribick Sondra C
Bought by
Stribick George R and Stribick Sondra C
Current Estimated Value
Home Financials for this Owner
Home Financials are based on the most recent Mortgage that was taken out on this home.
Original Mortgage
$147,000
Interest Rate
3.92%
Mortgage Type
New Conventional
Purchase Details
Closed on
Aug 28, 2007
Sold by
Stribick Sondra C
Bought by
Stribick George R
Purchase Details
Closed on
Jul 30, 1999
Sold by
Stribick George R and Stribick Sandra C
Bought by
Stribick Sondra C
Purchase Details
Closed on
Dec 7, 1983
Bought by
Stribick George R
Create a Home Valuation Report for This Property
The Home Valuation Report is an in-depth analysis detailing your home's value as well as a comparison with similar homes in the area
Home Values in the Area
Average Home Value in this Area
Purchase History
| Date | Buyer | Sale Price | Title Company |
|---|---|---|---|
| Stribick George R | -- | Lsi | |
| Stribick George R | -- | Stewart Tit | |
| Stribick Sondra C | -- | -- | |
| Stribick George R | $25,000 | -- |
Source: Public Records
Mortgage History
| Date | Status | Borrower | Loan Amount |
|---|---|---|---|
| Previous Owner | Stribick George R | $147,000 |
Source: Public Records
Tax History Compared to Growth
Tax History
| Year | Tax Paid | Tax Assessment Tax Assessment Total Assessment is a certain percentage of the fair market value that is determined by local assessors to be the total taxable value of land and additions on the property. | Land | Improvement |
|---|---|---|---|---|
| 2024 | $17,324 | $286,800 | $117,360 | $169,440 |
| 2023 | $16,027 | $286,790 | $117,355 | $169,435 |
| 2022 | $12,895 | $181,130 | $78,890 | $102,240 |
| 2021 | $12,394 | $181,130 | $78,890 | $102,240 |
| 2020 | $12,322 | $181,130 | $78,890 | $102,240 |
| 2019 | $11,648 | $157,500 | $68,600 | $88,900 |
| 2018 | $11,327 | $157,500 | $68,600 | $88,900 |
| 2017 | $14,481 | $227,430 | $101,710 | $125,720 |
| 2016 | $11,746 | $147,010 | $66,120 | $80,890 |
| 2015 | $11,442 | $147,010 | $66,120 | $80,890 |
| 2014 | $11,526 | $147,010 | $66,120 | $80,890 |
| 2013 | $5,616 | $140,000 | $62,965 | $77,035 |
Source: Public Records
Map
Nearby Homes
- 7125 Longfield Ct
- 6935 Kindler Dr
- 7090 Dean Farm Rd
- 7477 New Albany Links Dr
- 7072 Maynard Place E
- 7075 Maynard Place
- 7301 Wood Edge Ln
- 6993 Cunningham Dr
- 7013 Cunningham Dr
- 7385 Wood Edge Ln
- 7361 Wood Edge Ln
- 7595 Skarlocken Green
- 8600 Steeple Wood Dr
- 8951 Grate Park Square
- 7485 Central College Rd
- 5685 Jersey Dr
- 7850 Peter Hoover Rd
- 7839 Peter Hoover Rd
- 6879 E Walnut St
- 10937 Johnstown Rd
- 7412 Bevelhymer Rd
- 6850 Margarum Bend
- 6840 Margarum Bend
- 6860 Margarum Bend
- 6830 Margarum Bend
- 6870 Margarum Bend
- 6820 Margarum Bend
- 6880 Margarum Bend
- 0 Margarum Bend Unit LOT 443
- 6810 Margarum Bend
- 6890 Margarum Bend
- 6845 Margarum Bend
- 6835 Margarum Bend
- 6855 Margarum Bend
- 6825 Margarum Bend
- 6865 Margarum Bend
- 6815 Margarum Bend
- 6875 Margarum Bend
- 6900 Margarum Bend
- 6805 Margarum Bend