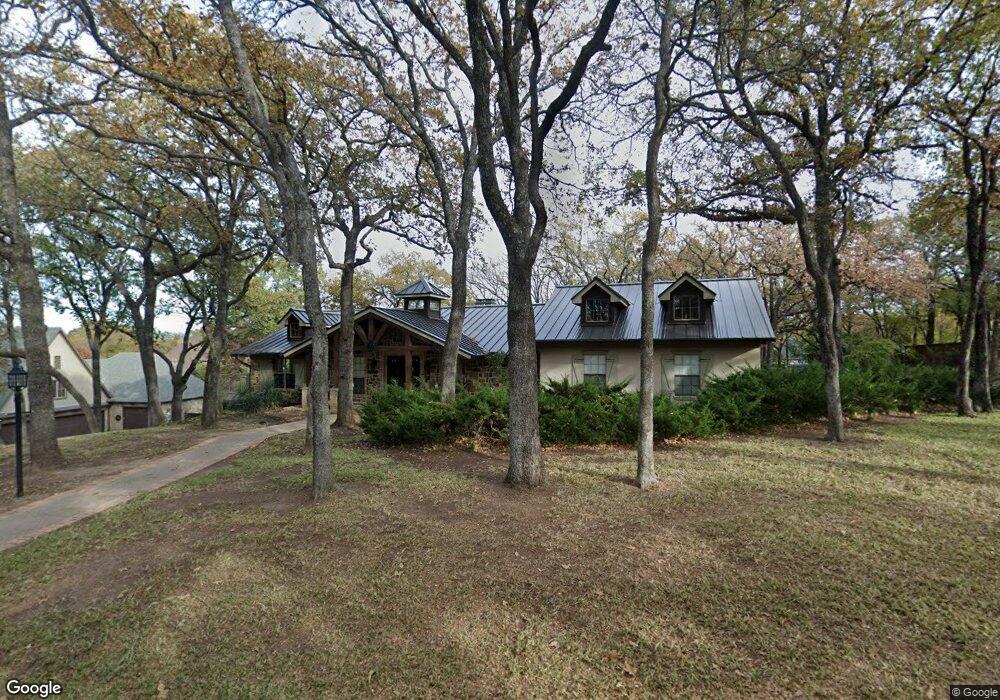
7401 Jo Will St Colleyville, TX 76034
Estimated Value: $832,871 - $1,025,000
5
Beds
3
Baths
3,112
Sq Ft
$300/Sq Ft
Est. Value
About This Home
This home is located at 7401 Jo Will St, Colleyville, TX 76034 and is currently estimated at $932,218, approximately $299 per square foot. 7401 Jo Will St is a home located in Tarrant County with nearby schools including Colleyville Elementary School, Cross Timbers Middle School, and Grapevine High School.
Ownership History
Date
Name
Owned For
Owner Type
Purchase Details
Closed on
Mar 18, 2011
Sold by
Buchholtz Sean P and Sharaf Mai
Bought by
Sharaf Mai and Buchholtz Sean P
Current Estimated Value
Purchase Details
Closed on
Jun 28, 2005
Sold by
Lahoda Thomas Harry
Bought by
Buchholtz Sean P
Home Financials for this Owner
Home Financials are based on the most recent Mortgage that was taken out on this home.
Original Mortgage
$359,200
Outstanding Balance
$187,628
Interest Rate
5.67%
Mortgage Type
Fannie Mae Freddie Mac
Estimated Equity
$744,590
Purchase Details
Closed on
Sep 25, 2004
Sold by
Lahoda Susan
Bought by
Lahoda Thomas H
Purchase Details
Closed on
Mar 24, 1999
Sold by
Newman Michael
Bought by
Lahoda Thomas Harry
Home Financials for this Owner
Home Financials are based on the most recent Mortgage that was taken out on this home.
Original Mortgage
$56,000
Interest Rate
7.16%
Create a Home Valuation Report for This Property
The Home Valuation Report is an in-depth analysis detailing your home's value as well as a comparison with similar homes in the area
Home Values in the Area
Average Home Value in this Area
Purchase History
| Date | Buyer | Sale Price | Title Company |
|---|---|---|---|
| Sharaf Mai | -- | None Available | |
| Buchholtz Sean P | -- | -- | |
| Lahoda Thomas H | -- | -- | |
| Lahoda Thomas Harry | -- | Alamo Title Co |
Source: Public Records
Mortgage History
| Date | Status | Borrower | Loan Amount |
|---|---|---|---|
| Open | Buchholtz Sean P | $359,200 | |
| Previous Owner | Lahoda Thomas Harry | $56,000 |
Source: Public Records
Tax History Compared to Growth
Tax History
| Year | Tax Paid | Tax Assessment Tax Assessment Total Assessment is a certain percentage of the fair market value that is determined by local assessors to be the total taxable value of land and additions on the property. | Land | Improvement |
|---|---|---|---|---|
| 2025 | $2,594 | $661,392 | $269,500 | $391,892 |
| 2024 | $2,594 | $661,392 | $269,500 | $391,892 |
| 2023 | $9,770 | $736,162 | $269,500 | $466,662 |
| 2022 | $10,399 | $624,022 | $269,500 | $354,522 |
| 2021 | $10,512 | $511,331 | $189,000 | $322,331 |
| 2020 | $9,670 | $461,035 | $189,000 | $272,035 |
| 2019 | $9,146 | $528,945 | $189,000 | $339,945 |
| 2018 | $2,138 | $359,636 | $189,000 | $170,636 |
| 2017 | $7,724 | $499,167 | $189,000 | $310,167 |
| 2016 | $7,022 | $395,271 | $186,000 | $209,271 |
| 2015 | $6,064 | $270,200 | $75,000 | $195,200 |
| 2014 | $6,064 | $270,200 | $75,000 | $195,200 |
Source: Public Records
Map
Nearby Homes
- 7312 Hix Ct
- 7255 Oak Alley Dr
- TBD - Lot 3 John Mccain Rd
- TBD - Lot 1 John Mccain Rd
- 7012 Shepherds Glen
- 7000 Shalimar Ct
- 6900 Sir Spencer Ct
- 7200 Belle Meade Dr
- 7106 Belle Meade Dr
- 6805 Shalimar Ct
- 1227 Strathmore Dr
- 7322 Calloway Ct
- 7316 Calloway Ct
- 1417 Nottoway Ct
- 1418 Nottoway Ct
- 1406 Nottoway Ct
- 608 Regency Crossing
- 1420 Kensington Ct
- 7607 Monticello Pkwy
- 521 Regency Crossing
- 7405 Jo Will St
- 7404 Jo Will St
- 7400 Jo Will St
- 7331 Cedar Ct
- 7408 Jo Will St
- 7412 Jo Will St
- 7312 Cedar Ct
- 7312 Jo Will St
- 7327 Cedar Ct
- 7309 Jo Will St
- 7308 Jo Will St
- 7308 Cedar Ct
- 7323 Cedar Ct
- 7305 Jo Will St
- 7317 Cedar Ct
- 7304 Jo Will St
- 7304 Cedar Ct
- 7309 Cedar Ct
- 7301 Jo Will St
- 7213 Waldon Ct