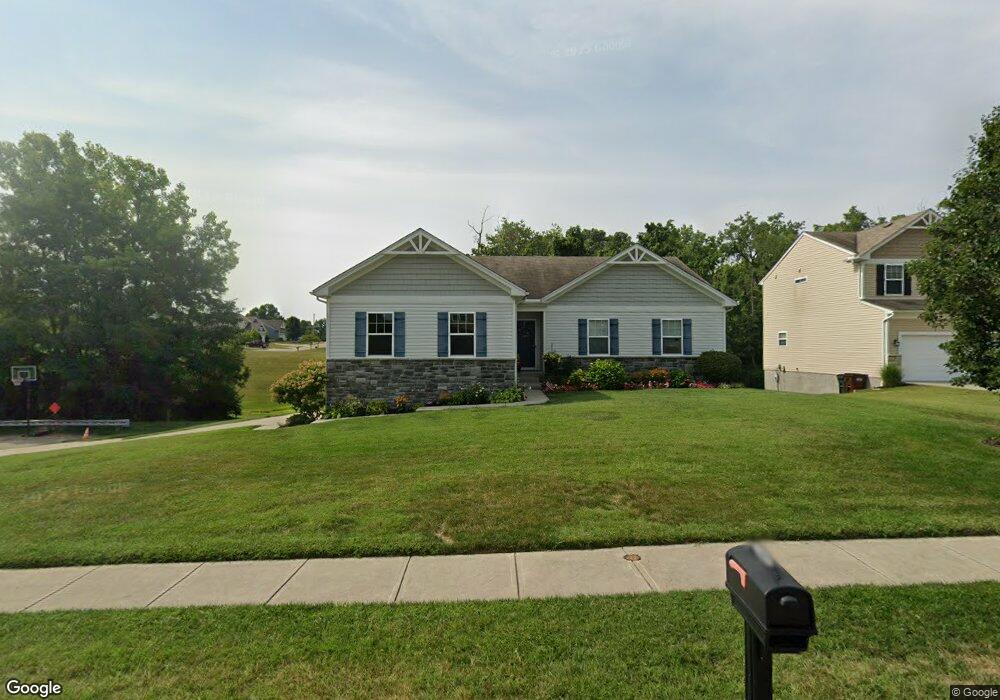
7403 Locust View Ln Cincinnati, OH 45239
Estimated Value: $326,287 - $423,000
3
Beds
2
Baths
1,627
Sq Ft
$227/Sq Ft
Est. Value
About This Home
This home is located at 7403 Locust View Ln, Cincinnati, OH 45239 and is currently estimated at $369,072, approximately $226 per square foot. 7403 Locust View Ln is a home with nearby schools including White Oak Middle School, Colerain High School, and Cincinnati Achievement Academy.
Ownership History
Date
Name
Owned For
Owner Type
Purchase Details
Closed on
Jul 11, 2016
Sold by
Leazer Tiffany L and Leazer Jared
Bought by
Leazer Jared and Leazer Tiffany L
Current Estimated Value
Purchase Details
Closed on
Jul 20, 2010
Sold by
Potterhill Homes Llc
Bought by
Williams Tiffany L
Home Financials for this Owner
Home Financials are based on the most recent Mortgage that was taken out on this home.
Original Mortgage
$179,621
Outstanding Balance
$118,393
Interest Rate
4.87%
Mortgage Type
FHA
Estimated Equity
$250,679
Purchase Details
Closed on
Mar 25, 2009
Sold by
Kerdan Development At Banning Road Llc
Bought by
Potterhill Homes Llc
Create a Home Valuation Report for This Property
The Home Valuation Report is an in-depth analysis detailing your home's value as well as a comparison with similar homes in the area
Home Values in the Area
Average Home Value in this Area
Purchase History
| Date | Buyer | Sale Price | Title Company |
|---|---|---|---|
| Leazer Jared | -- | American Homeland Title | |
| Williams Tiffany L | $182,041 | American Homeland Title Agen | |
| Potterhill Homes Llc | $1,036,956 | Attorney |
Source: Public Records
Mortgage History
| Date | Status | Borrower | Loan Amount |
|---|---|---|---|
| Open | Williams Tiffany L | $179,621 |
Source: Public Records
Tax History
| Year | Tax Paid | Tax Assessment Tax Assessment Total Assessment is a certain percentage of the fair market value that is determined by local assessors to be the total taxable value of land and additions on the property. | Land | Improvement |
|---|---|---|---|---|
| 2025 | $5,330 | $91,161 | $17,010 | $74,151 |
| 2023 | $4,961 | $91,161 | $17,010 | $74,151 |
| 2022 | $4,268 | $63,862 | $13,381 | $50,481 |
| 2021 | $4,228 | $63,862 | $13,381 | $50,481 |
| 2020 | $4,271 | $63,862 | $13,381 | $50,481 |
| 2019 | $3,880 | $54,121 | $11,340 | $42,781 |
| 2018 | $3,485 | $54,121 | $11,340 | $42,781 |
| 2017 | $3,252 | $54,121 | $11,340 | $42,781 |
| 2016 | $3,920 | $63,714 | $15,400 | $48,314 |
| 2015 | $3,958 | $63,714 | $15,400 | $48,314 |
| 2014 | $3,964 | $63,714 | $15,400 | $48,314 |
| 2013 | $3,787 | $63,714 | $15,400 | $48,314 |
Source: Public Records
Map
Nearby Homes
- 3510 Banning Rd
- 3329 Alexis Rd
- 3397 Nandale Dr
- 3336 Nandale Dr
- 6893 Newbridge Dr
- 3408 Rocker Dr
- 6724 Cheviot Rd
- 3407 Lapland Dr
- 3250 March Terrace
- 3150 Banning Rd
- 3140 Banning Rd
- 3727 Hanley Rd
- 3631 Semloh Ave
- 3693 W Galbraith Rd
- 3691 W Galbraith Rd
- 6321 Duet Ln
- 3701 W Galbraith Rd
- 3181 Preserve Ln
- 3181 Preserve Ln Unit 1C
- 3269 Warfield Ave
- 7415 Locust View Ln
- 7427 Locust View Ln
- 7389 Locust View Ln
- 7400 Locust View Ln
- 7247 Rolling Oaks Ct
- 7412 Locust View Ln
- 7424 Locust View Ln
- 7439 Locust View Ln
- 7239 Rolling Oaks Ct
- 7388 Locust View Ln
- 7375 Locust View Ln
- 7469 Barjo Ln
- 7436 Locust View Ln
- 7246 Rolling Oaks Ct
- 7374 Locust View Ln
- 7363 Locust View Ln
- 7468 Barjo Ln
- 7231 Rolling Oaks Ct
- 3389 Alexis Rd
- 3393 Alexis Rd
Your Personal Tour Guide
Ask me questions while you tour the home.