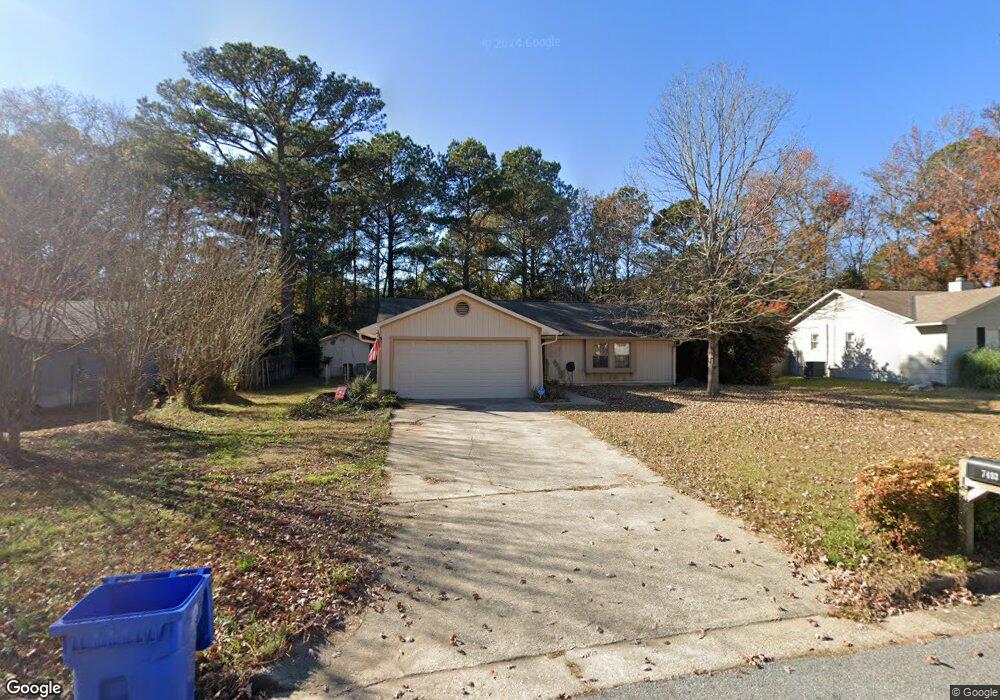
7403 Sesame St Columbus, GA 31909
Northern Columbus NeighborhoodEstimated Value: $220,695 - $245,000
3
Beds
3
Baths
1,416
Sq Ft
$165/Sq Ft
Est. Value
About This Home
This home is located at 7403 Sesame St, Columbus, GA 31909 and is currently estimated at $233,924, approximately $165 per square foot. 7403 Sesame St is a home located in Muscogee County with nearby schools including Double Churches Elementary School, Double Churches Middle School, and Northside High School.
Ownership History
Date
Name
Owned For
Owner Type
Purchase Details
Closed on
Nov 8, 2022
Sold by
Krot Katie P
Bought by
Krot David P and Krot Robert
Current Estimated Value
Purchase Details
Closed on
Sep 5, 2022
Sold by
King Wren
Bought by
Krot David P and Krot Robert
Purchase Details
Closed on
Apr 2, 2019
Sold by
Ludwick Amy M
Bought by
Krot Katie
Purchase Details
Closed on
Dec 4, 2015
Sold by
Runci Eric A
Bought by
Ludwick Amy M
Home Financials for this Owner
Home Financials are based on the most recent Mortgage that was taken out on this home.
Original Mortgage
$144,337
Interest Rate
3.25%
Mortgage Type
FHA
Purchase Details
Closed on
Apr 1, 2010
Sold by
Earl Sears Properties Llc
Bought by
Runci Eric A
Home Financials for this Owner
Home Financials are based on the most recent Mortgage that was taken out on this home.
Original Mortgage
$141,391
Interest Rate
4.87%
Mortgage Type
FHA
Purchase Details
Closed on
Nov 13, 2009
Sold by
Dietz Donald E and Dietz Rebecca S
Bought by
Earl Sears Properties Llc
Create a Home Valuation Report for This Property
The Home Valuation Report is an in-depth analysis detailing your home's value as well as a comparison with similar homes in the area
Home Values in the Area
Average Home Value in this Area
Purchase History
| Date | Buyer | Sale Price | Title Company |
|---|---|---|---|
| Krot David P | -- | -- | |
| Krot David P | -- | -- | |
| Krot Katie | $145,500 | -- | |
| Ludwick Amy M | $147,000 | -- | |
| Runci Eric A | $144,000 | None Available | |
| Earl Sears Properties Llc | $86,000 | None Available |
Source: Public Records
Mortgage History
| Date | Status | Borrower | Loan Amount |
|---|---|---|---|
| Previous Owner | Ludwick Amy M | $144,337 | |
| Previous Owner | Runci Eric A | $141,391 |
Source: Public Records
Tax History Compared to Growth
Tax History
| Year | Tax Paid | Tax Assessment Tax Assessment Total Assessment is a certain percentage of the fair market value that is determined by local assessors to be the total taxable value of land and additions on the property. | Land | Improvement |
|---|---|---|---|---|
| 2025 | $1,983 | $63,832 | $13,108 | $50,724 |
| 2024 | $1,981 | $63,832 | $13,108 | $50,724 |
| 2023 | $1,300 | $63,832 | $13,108 | $50,724 |
| 2022 | $2,212 | $54,172 | $13,108 | $41,064 |
| 2021 | $2,096 | $51,220 | $13,108 | $38,112 |
| 2020 | $2,181 | $53,392 | $13,108 | $40,284 |
| 2019 | $2,188 | $53,392 | $13,108 | $40,284 |
| 2018 | $2,188 | $53,392 | $13,108 | $40,284 |
| 2017 | $2,194 | $53,392 | $13,108 | $40,284 |
| 2016 | $2,376 | $57,600 | $8,000 | $49,600 |
| 2015 | $2,379 | $57,600 | $8,000 | $49,600 |
| 2014 | $2,382 | $57,600 | $8,000 | $49,600 |
| 2013 | -- | $57,600 | $8,000 | $49,600 |
Source: Public Records
Map
Nearby Homes
- 7407 Peppercorn Dr
- 7313 Sesame St
- 8008 Lagoon Ct
- 1719 Double Churches Rd
- 7995 Big Creek Place
- 7185 Helen Dr
- 1438 Grove Park Dr Unit 13B
- 18 Peppertree Ct
- 7559 Crescent Dr
- 1512 Tom Buk Tu Ln
- 1355 Cloverdale Rd
- 6818 Fawndale Dr
- 6810 Fawndale Dr
- 1535 Doubletree Dr
- 7047 Mellwood Rd
- 1727 Fountain Ct
- 6817 Whitesville Rd
- 6825 Ellis Dr
- 6802 Ellis Dr
- 1579 Magnolia Way
- 7357 Sesame St
- 7407 Sesame St
- 7351 Sesame St
- 7404 Sesame St
- 7415 Sesame St
- 7412 Sesame St
- 7343 Sesame St
- 2000 Chervil Dr
- 0 Sesame St Unit 8424895
- 0 Sesame St Unit 8003839
- 0 Sesame St
- 7401 Peppercorn Dr
- 7421 Sesame St
- 7422 Sesame St
- 7337 Sesame St
- 7342 Sesame St
- 7415 Peppercorn Dr
- 7427 Sesame St
- 7423 Peppercorn Dr
- 2018 Chervil Dr