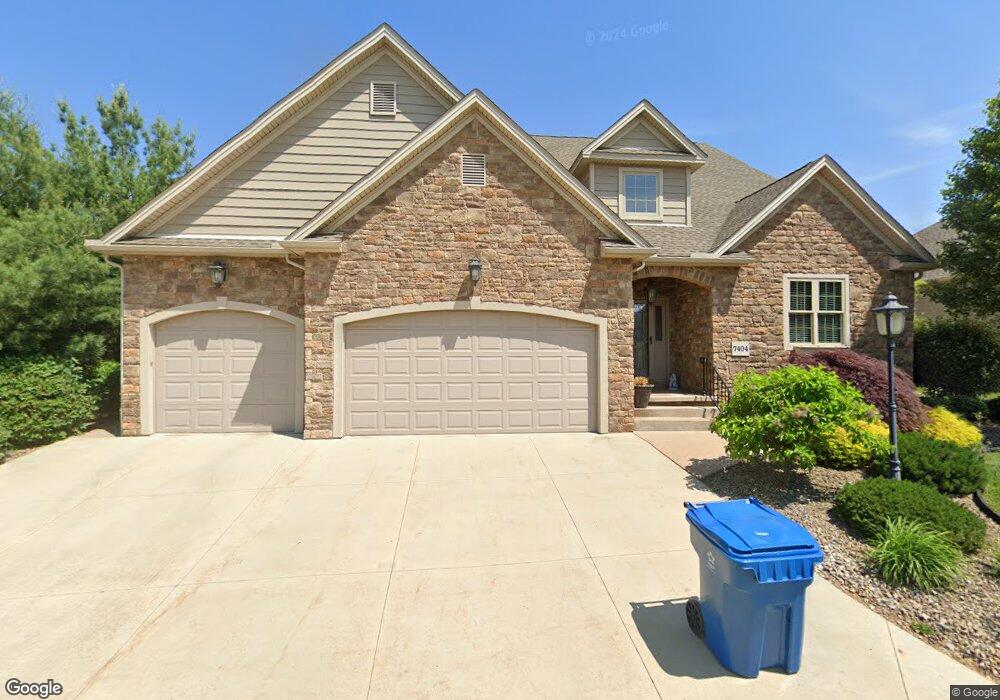
7404 Drury Ln Unit 7 Canfield, OH 44406
Estimated Value: $623,000 - $895,000
3
Beds
5
Baths
3,236
Sq Ft
$238/Sq Ft
Est. Value
About This Home
This home is located at 7404 Drury Ln Unit 7, Canfield, OH 44406 and is currently estimated at $770,069, approximately $237 per square foot. 7404 Drury Ln Unit 7 is a home located in Mahoning County with nearby schools including Canfield Village Middle School, Canfield High School, and St Charles Elementary School.
Ownership History
Date
Name
Owned For
Owner Type
Purchase Details
Closed on
Sep 8, 2020
Sold by
Creatore Ronald M and The Joseph D Bettura Irrevocab
Bought by
Singh Ravinder K and Singh Tejdeep
Current Estimated Value
Home Financials for this Owner
Home Financials are based on the most recent Mortgage that was taken out on this home.
Original Mortgage
$154,000
Outstanding Balance
$109,897
Interest Rate
2.9%
Mortgage Type
New Conventional
Estimated Equity
$660,172
Purchase Details
Closed on
Dec 16, 2016
Sold by
Bettura Dominic J
Bought by
Creatore Ronald M
Purchase Details
Closed on
Dec 4, 2013
Sold by
Ludt Gretchen
Bought by
Jb Construction Co Ltd
Purchase Details
Closed on
Nov 13, 2012
Sold by
C T W Development Corporation
Bought by
Creatore Ronald M
Create a Home Valuation Report for This Property
The Home Valuation Report is an in-depth analysis detailing your home's value as well as a comparison with similar homes in the area
Home Values in the Area
Average Home Value in this Area
Purchase History
| Date | Buyer | Sale Price | Title Company |
|---|---|---|---|
| Singh Ravinder K | $523,000 | None Available | |
| The Joseph D Bettura Irrevocable Trust | -- | None Available | |
| Creatore Ronald M | -- | None Available | |
| Jb Construction Co Ltd | $68,000 | Attorney | |
| Creatore Ronald M | $57,000 | None Available |
Source: Public Records
Mortgage History
| Date | Status | Borrower | Loan Amount |
|---|---|---|---|
| Open | Singh Ravinder K | $154,000 |
Source: Public Records
Tax History Compared to Growth
Tax History
| Year | Tax Paid | Tax Assessment Tax Assessment Total Assessment is a certain percentage of the fair market value that is determined by local assessors to be the total taxable value of land and additions on the property. | Land | Improvement |
|---|---|---|---|---|
| 2024 | $7,584 | $186,530 | $24,500 | $162,030 |
| 2023 | $7,498 | $186,530 | $24,500 | $162,030 |
| 2022 | $8,249 | $164,090 | $21,000 | $143,090 |
| 2021 | $7,990 | $164,090 | $21,000 | $143,090 |
| 2020 | $8,025 | $164,090 | $21,000 | $143,090 |
| 2019 | $7,138 | $131,070 | $21,000 | $110,070 |
| 2018 | $6,888 | $131,070 | $21,000 | $110,070 |
| 2017 | $7,043 | $131,070 | $21,000 | $110,070 |
| 2016 | $6,955 | $123,260 | $21,000 | $102,260 |
| 2015 | $6,805 | $123,260 | $21,000 | $102,260 |
| 2014 | $6,835 | $123,260 | $21,000 | $102,260 |
| 2013 | $1,011 | $18,900 | $18,900 | $0 |
Source: Public Records
Map
Nearby Homes
- 6837 Abbey Rd S
- 6839 Abbey Rd S
- 6845 Abbey Rd
- 6843 Abbey Rd
- 5025 Macy Ln
- 5034 Macy Ln
- 6850 Abbey Rd N
- 7245 Hanbury Close
- 4300 Westford Place Unit 13D
- 6670 Summit Dr
- 6645 Summit Dr
- 4808 Leffingwell Rd
- 6857 Kyle Ridge Pointe
- 6879 Kyle Ridge Pointe
- 4032 Saint Andrews Ct Unit 1
- 6836 Twin Oaks Ct
- 473 Carriage Hill Dr
- 8075 S Raccoon Rd
- 5060 Leffingwell Rd
- 419 Carriage Hill Dr
- 7404 Drury Ln
- 7707 Exeter Ct
- 7600 Brixton Crest
- 7416 Drury Ln
- 62 Exeter Ct
- 7706 Exeter Ct
- 6827 Langston Run
- 6821 Langston Run
- 7719 Exeter Ct
- 7718 Exeter Ct
- 7605 Brixton Crescent
- 0 Exeter Ct
- LOT 57 Exeter Ct
- 62 Lot Exeter Ct
- 7730 Exeter Ct
- 7610 Brixton Crescent
- 7620 Brixton Crest
- 7767 Exeter Ct
- 7742 Exeter Ct
- 6815 Langston Run