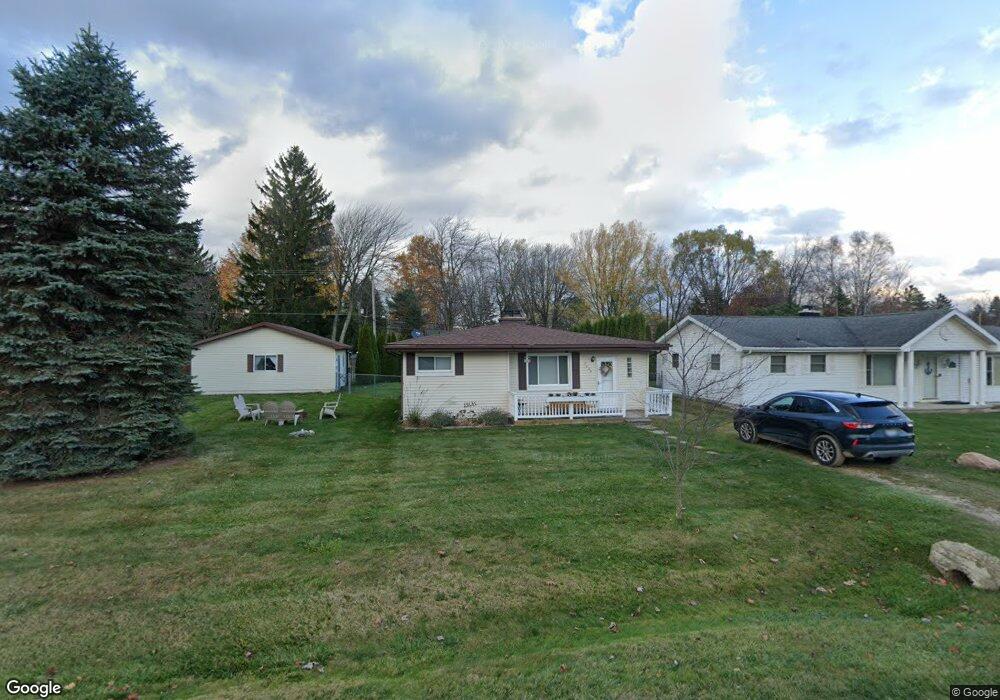
7405 Birch Tree Rd Unit TREE Lexington, MI 48450
Estimated Value: $206,000 - $231,000
2
Beds
1
Bath
800
Sq Ft
$269/Sq Ft
Est. Value
About This Home
This home is located at 7405 Birch Tree Rd Unit TREE, Lexington, MI 48450 and is currently estimated at $215,530, approximately $269 per square foot. 7405 Birch Tree Rd Unit TREE is a home located in Sanilac County.
Ownership History
Date
Name
Owned For
Owner Type
Purchase Details
Closed on
Jul 23, 2024
Sold by
Coronado Gabriel C and Taylor Janet L
Bought by
Young Jerri
Current Estimated Value
Home Financials for this Owner
Home Financials are based on the most recent Mortgage that was taken out on this home.
Original Mortgage
$105,000
Outstanding Balance
$103,417
Interest Rate
5.75%
Mortgage Type
New Conventional
Estimated Equity
$112,114
Purchase Details
Closed on
Jun 11, 2020
Sold by
Pray and Debra
Bought by
Taylor Janet L and Coronado Gabriel C
Home Financials for this Owner
Home Financials are based on the most recent Mortgage that was taken out on this home.
Original Mortgage
$112,500
Interest Rate
3.2%
Mortgage Type
Construction
Purchase Details
Closed on
Sep 16, 2003
Sold by
Martin Ronald and Jones Nanette
Bought by
Pray John and Pray Debra
Purchase Details
Closed on
Sep 21, 1998
Bought by
Martin Ronald and Jones Nanette
Purchase Details
Closed on
Jan 22, 1997
Sold by
Busenhart Richard
Bought by
Bkusenhart Richard
Create a Home Valuation Report for This Property
The Home Valuation Report is an in-depth analysis detailing your home's value as well as a comparison with similar homes in the area
Home Values in the Area
Average Home Value in this Area
Purchase History
| Date | Buyer | Sale Price | Title Company |
|---|---|---|---|
| Young Jerri | $205,000 | Ata National Title | |
| Young Jerri | $205,000 | Ata Nat L Title | |
| Taylor Janet L | $125,000 | -- | |
| Pray John | $92,400 | -- | |
| Martin Ronald | $70,000 | -- | |
| Bkusenhart Richard | -- | -- |
Source: Public Records
Mortgage History
| Date | Status | Borrower | Loan Amount |
|---|---|---|---|
| Open | Young Jerri | $105,000 | |
| Closed | Young Jerri | $105,000 | |
| Previous Owner | Taylor Janet L | $112,500 |
Source: Public Records
Tax History Compared to Growth
Tax History
| Year | Tax Paid | Tax Assessment Tax Assessment Total Assessment is a certain percentage of the fair market value that is determined by local assessors to be the total taxable value of land and additions on the property. | Land | Improvement |
|---|---|---|---|---|
| 2025 | $1,762 | $83,900 | $0 | $0 |
| 2024 | $458 | $73,300 | $0 | $0 |
| 2023 | $436 | $53,500 | $0 | $0 |
| 2022 | $2,426 | $45,700 | $0 | $0 |
| 2021 | $3,173 | $40,500 | $0 | $0 |
| 2020 | $2,152 | $35,000 | $0 | $0 |
| 2019 | $794 | $40,400 | $0 | $0 |
| 2018 | $2,302 | $50,000 | $0 | $0 |
| 2017 | $1,984 | $41,900 | $0 | $0 |
| 2016 | $377 | $38,700 | $0 | $0 |
| 2015 | -- | $38,700 | $0 | $0 |
| 2014 | -- | $39,000 | $0 | $0 |
Source: Public Records
Map
Nearby Homes
- VL Birchtree Rd
- 7472 Elmwood Rd
- 7525 Elmwood Rd
- 7620 Holiday Rd
- 7277 Elmwood Rd
- 000 Birchwood Rd
- Lot 537 Woodbine Rd
- 0000 Lakeshore Rd
- 00 Lakeshore Rd
- 7690 Holiday Blvd
- 7435 Lakewood Rd
- 00 Joy
- VL Dian Rd
- 7454 Aspen Rd
- 00 M 25
- 7477 Aspen Rd
- 7102 Lakeview Dr
- 7779 Sanilac Ave
- 7175 Birchcrest Rd
- 7422 Elm Rd
- 7405 Birch Tree Rd
- 7405 Birchtree Rd
- 0 Birchtree Unit 31333004
- 0 Birchtree Unit 4622364
- 0 Birchtree Unit 4669287
- V/L Birchtree Rd
- 0 Birchtree Unit 20230002936
- 0 Birchtree Unit G31180998
- 0 Birchtree Unit G31216453
- 0 Birchtree Unit G31294515
- 0 Birchtree Unit G50022170
- 0 Birchtree Rd
- 00 Birchtree Rd
- 000 Birchtree Rd
- 0 Birchtree Unit 219099245
- 0 Birchtree Unit 219042400
- 7413 Birch Tree Rd
- 7409 Beechwood Rd
- 7561 Forest Dr
- 7413 Beechwood Rd