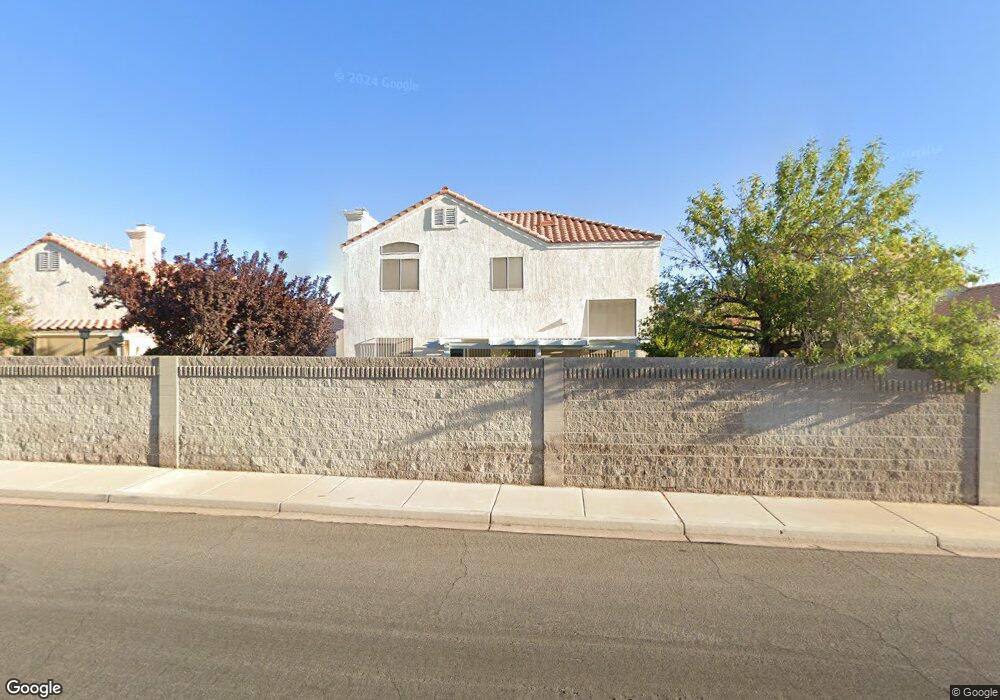
7405 Tamarind Ave Las Vegas, NV 89147
Estimated Value: $472,067 - $506,000
4
Beds
3
Baths
1,973
Sq Ft
$246/Sq Ft
Est. Value
About This Home
This home is located at 7405 Tamarind Ave, Las Vegas, NV 89147 and is currently estimated at $485,517, approximately $246 per square foot. 7405 Tamarind Ave is a home located in Clark County with nearby schools including Pat Diskin Elementary School, Clifford J Lawrence Junior High School, and Spring Valley High School.
Ownership History
Date
Name
Owned For
Owner Type
Purchase Details
Closed on
May 17, 2013
Sold by
Hawkins Ronnie J and Hawkins Linda K
Bought by
Hawkins Ronnie J and Hawkins Linda K
Current Estimated Value
Purchase Details
Closed on
Feb 22, 1999
Sold by
Martin Scott L and Martin Jennifer C
Bought by
Hawkins Ronnie J and Hawkins Linda K
Home Financials for this Owner
Home Financials are based on the most recent Mortgage that was taken out on this home.
Original Mortgage
$155,530
Outstanding Balance
$36,939
Interest Rate
6.78%
Mortgage Type
VA
Estimated Equity
$448,578
Purchase Details
Closed on
Sep 27, 1994
Sold by
Greenpark Construction
Bought by
Martin Scott L and Martin Jennifer C
Home Financials for this Owner
Home Financials are based on the most recent Mortgage that was taken out on this home.
Original Mortgage
$109,377
Interest Rate
8.58%
Create a Home Valuation Report for This Property
The Home Valuation Report is an in-depth analysis detailing your home's value as well as a comparison with similar homes in the area
Home Values in the Area
Average Home Value in this Area
Purchase History
| Date | Buyer | Sale Price | Title Company |
|---|---|---|---|
| Hawkins Ronnie J | -- | None Available | |
| Hawkins Ronnie J | $151,500 | Nevada Title Company | |
| Martin Scott L | $137,000 | Land Title |
Source: Public Records
Mortgage History
| Date | Status | Borrower | Loan Amount |
|---|---|---|---|
| Open | Hawkins Ronnie J | $155,530 | |
| Previous Owner | Martin Scott L | $109,377 |
Source: Public Records
Tax History Compared to Growth
Tax History
| Year | Tax Paid | Tax Assessment Tax Assessment Total Assessment is a certain percentage of the fair market value that is determined by local assessors to be the total taxable value of land and additions on the property. | Land | Improvement |
|---|---|---|---|---|
| 2025 | $1,633 | $97,969 | $33,250 | $64,719 |
| 2024 | $1,586 | $97,969 | $33,250 | $64,719 |
| 2023 | $1,586 | $96,732 | $35,000 | $61,732 |
| 2022 | $1,550 | $84,198 | $27,650 | $56,548 |
| 2021 | $1,509 | $78,534 | $24,500 | $54,034 |
| 2020 | $1,459 | $78,218 | $24,500 | $53,718 |
| 2019 | $1,416 | $72,849 | $19,950 | $52,899 |
| 2018 | $1,376 | $68,403 | $17,500 | $50,903 |
| 2017 | $1,876 | $69,237 | $17,500 | $51,737 |
| 2016 | $1,301 | $62,991 | $12,600 | $50,391 |
| 2015 | $1,300 | $60,151 | $10,850 | $49,301 |
| 2014 | $1,261 | $46,579 | $9,100 | $37,479 |
Source: Public Records
Map
Nearby Homes
- 3869 Spruceview Ct
- 3974 Round Wood St
- 7231 Sequoia Springs Dr
- 7400 W Flamingo Rd Unit 1071
- 7400 W Flamingo Rd Unit 2094
- 7400 W Flamingo Rd Unit 2033
- 7400 W Flamingo Rd Unit 1033
- 7400 W Flamingo Rd Unit 2013
- 7570 W Flamingo Rd Unit 219
- 7570 W Flamingo Rd Unit 125
- 7150 Mountain Moss Dr
- 7072 Parasol Ln
- 4121 Satinwood Dr
- 6999 Mountain Moss Dr
- 7015 Quarry Dr
- 6979 Stober Ct
- 7300 Lavender Rose Ave
- 7285 Pinebrook Cir
- 4144 Moorcroft St
- 3685 Springbud Dr
- 7411 Tamarind Ave Unit 1
- 7397 Tamarind Ave
- 7389 Tamarind Ave
- 7421 Tamarind Ave
- 3870 Birchview Ct
- 3869 Birchview Ct
- 7381 Tamarind Ave
- 7429 Tamarind Ave
- 3862 Birchview Ct
- 3861 Birchview Ct
- 7406 Cedar Ridge St
- 7398 Cedar Ridge St
- 7414 Cedar Ridge St
- 3871 Almondview St
- 7437 Tamarind Ave
- 7373 Tamarind Ave
- 7390 Cedar Ridge St
- 7422 Cedar Ridge St
- 3854 Birchview Ct
- 7382 Cedar Ridge St