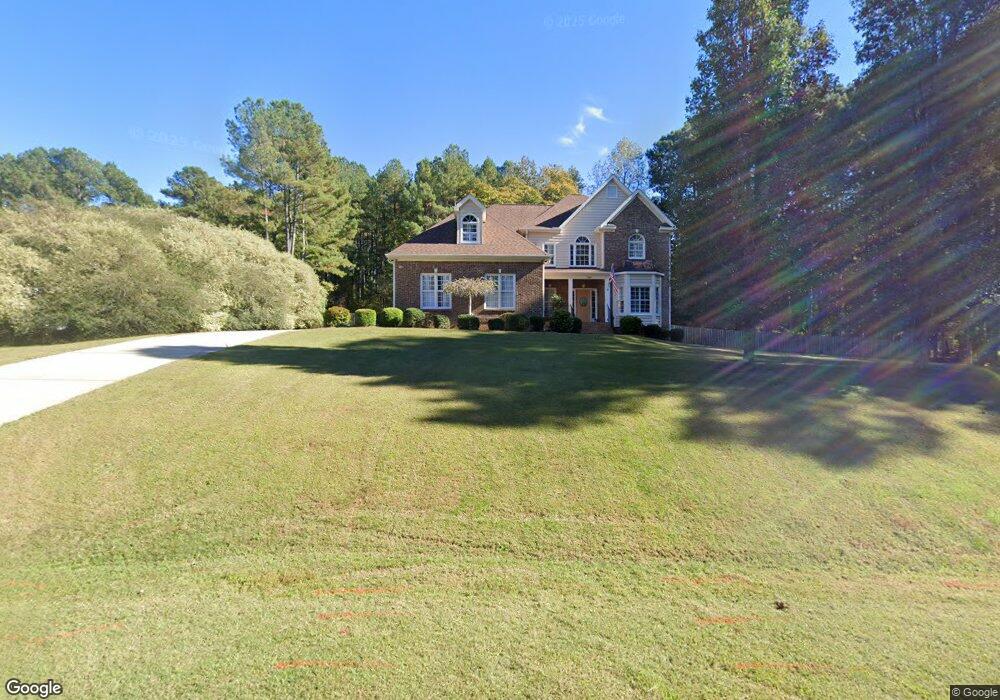
7406 Oriole Dr Wake Forest, NC 27587
Falls Lake NeighborhoodEstimated Value: $765,000 - $852,000
4
Beds
4
Baths
3,242
Sq Ft
$244/Sq Ft
Est. Value
About This Home
This home is located at 7406 Oriole Dr, Wake Forest, NC 27587 and is currently estimated at $790,036, approximately $243 per square foot. 7406 Oriole Dr is a home located in Wake County with nearby schools including North Forest Pines Elementary School, Wakefield Middle, and Wakefield High School.
Ownership History
Date
Name
Owned For
Owner Type
Purchase Details
Closed on
Feb 17, 2005
Sold by
Eci Custom Homes Inc
Bought by
Keffer Victor W and Keffer Gabrielle
Current Estimated Value
Home Financials for this Owner
Home Financials are based on the most recent Mortgage that was taken out on this home.
Original Mortgage
$261,000
Outstanding Balance
$132,138
Interest Rate
5.69%
Mortgage Type
Fannie Mae Freddie Mac
Estimated Equity
$657,898
Purchase Details
Closed on
Feb 27, 2004
Sold by
Kirby Marshburn Bldg Corp
Bought by
Eci Custom Homes Inc
Purchase Details
Closed on
Nov 7, 2002
Sold by
Kirby Marshburn Bldg Corp
Bought by
James Zachary Mark
Home Financials for this Owner
Home Financials are based on the most recent Mortgage that was taken out on this home.
Original Mortgage
$74,000
Interest Rate
5.93%
Create a Home Valuation Report for This Property
The Home Valuation Report is an in-depth analysis detailing your home's value as well as a comparison with similar homes in the area
Home Values in the Area
Average Home Value in this Area
Purchase History
| Date | Buyer | Sale Price | Title Company |
|---|---|---|---|
| Keffer Victor W | $392,000 | -- | |
| Eci Custom Homes Inc | $69,000 | -- | |
| James Zachary Mark | $69,000 | -- |
Source: Public Records
Mortgage History
| Date | Status | Borrower | Loan Amount |
|---|---|---|---|
| Open | Keffer Victor W | $261,000 | |
| Previous Owner | James Zachary Mark | $74,000 |
Source: Public Records
Tax History
| Year | Tax Paid | Tax Assessment Tax Assessment Total Assessment is a certain percentage of the fair market value that is determined by local assessors to be the total taxable value of land and additions on the property. | Land | Improvement |
|---|---|---|---|---|
| 2025 | $4,845 | $754,416 | $90,000 | $664,416 |
| 2024 | $4,705 | $754,416 | $90,000 | $664,416 |
Source: Public Records
Map
Nearby Homes
- 8413 Portmarnock Ct
- 8421 Portmarnock Ct
- 2200 Paddstowe Main Way
- 8417 Portmarnock Ct
- 2213 Paddstowe Main Way
- 7417 Dover Hills Dr
- 2312 Blue Crab Ct
- 8600 Deep Elm Dr
- 12705 Shephards Landing Dr
- 2100 Lowery Estates Dr
- 2108 Lowery Estates Dr
- 12708 Shephards Landing Dr
- 2105 Lowery Estates Dr
- 2040 Pleasant Forest Way
- 8613 Breezy Grove Trail
- 8805 Rainer Way
- 2405 Welsh Tavern Way
- 7440 Hasentree Way
- 2341 Knoll Ridge Ln
- 2420 Mollynick Ln
- 7048 Shady Glen Ln
- 7408 Oriole Dr
- 7405 Oriole Dr
- 7409 Oriole Dr
- 7409 Oriole Dr Unit Lt 19
- 7040 Shady Glen Ln
- 7045 Shady Glen Ln
- 7420 Oriole Dr
- 7037 Shady Glen Ln
- 7109 Shady Glen Ln
- 7421 Oriole Dr
- 7108 Shady Glen Ln
- 13621 Camp Kanata Rd
- 7032 Shady Glen Ln
- 7424 Oriole Dr
- 7021 Shady Glen Ln
- 7100 Shady Glen Ln
- 7052 Shady Glen Ln
- 7429 Oriole Dr
- 7428 Oriole Dr
Your Personal Tour Guide
Ask me questions while you tour the home.