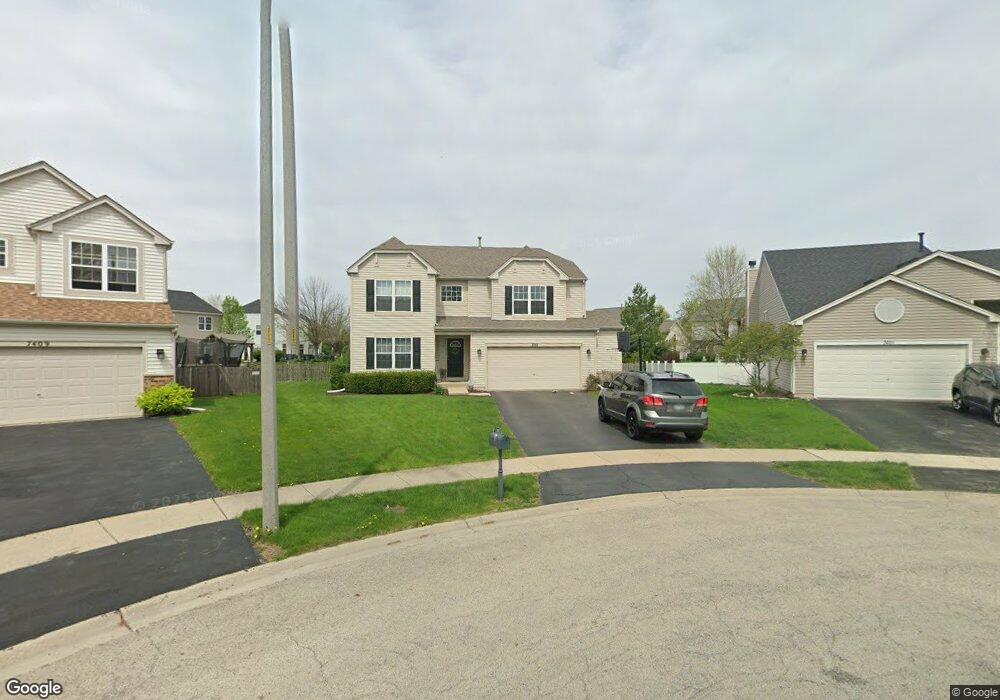
7407 Fordham Ct Unit 1 Plainfield, IL 60586
North Minooka NeighborhoodEstimated Value: $408,000 - $430,000
Studio
1
Bath
2,460
Sq Ft
$170/Sq Ft
Est. Value
About This Home
This home is located at 7407 Fordham Ct Unit 1, Plainfield, IL 60586 and is currently estimated at $418,806, approximately $170 per square foot. 7407 Fordham Ct Unit 1 is a home located in Kendall County with nearby schools including Charles Reed Elementary School, Aux Sable Middle School, and Plainfield South High School.
Ownership History
Date
Name
Owned For
Owner Type
Purchase Details
Closed on
Nov 28, 2008
Sold by
Neumann Homes Inc
Bought by
Guaranty Plus Properties Inc I
Current Estimated Value
Purchase Details
Closed on
Nov 19, 2004
Sold by
Neumann Homes Inc
Bought by
Curbis Michael and Curbis Joy
Home Financials for this Owner
Home Financials are based on the most recent Mortgage that was taken out on this home.
Original Mortgage
$190,235
Interest Rate
5.83%
Mortgage Type
Purchase Money Mortgage
Create a Home Valuation Report for This Property
The Home Valuation Report is an in-depth analysis detailing your home's value as well as a comparison with similar homes in the area
Home Values in the Area
Average Home Value in this Area
Purchase History
| Date | Buyer | Sale Price | Title Company |
|---|---|---|---|
| Guaranty Plus Properties Inc I | -- | First American Title Ins Co | |
| Curbis Michael | $238,000 | Chicago Title Insurance Co |
Source: Public Records
Mortgage History
| Date | Status | Borrower | Loan Amount |
|---|---|---|---|
| Previous Owner | Curbis Michael | $190,235 |
Source: Public Records
Tax History
| Year | Tax Paid | Tax Assessment Tax Assessment Total Assessment is a certain percentage of the fair market value that is determined by local assessors to be the total taxable value of land and additions on the property. | Land | Improvement |
|---|---|---|---|---|
| 2024 | $8,579 | $124,638 | $15,449 | $109,189 |
| 2023 | $7,478 | $113,682 | $13,434 | $100,248 |
| 2022 | $7,478 | $99,905 | $13,133 | $86,772 |
| 2021 | $7,035 | $92,430 | $13,111 | $79,319 |
| 2020 | $6,390 | $83,047 | $13,027 | $70,020 |
| 2019 | $6,252 | $80,109 | $13,027 | $67,082 |
| 2018 | $6,442 | $80,109 | $13,027 | $67,082 |
| 2017 | $6,458 | $77,655 | $13,027 | $64,628 |
| 2016 | $6,158 | $72,694 | $12,866 | $59,828 |
| 2015 | $5,890 | $66,651 | $12,210 | $54,441 |
| 2014 | -- | $64,447 | $12,210 | $52,237 |
| 2013 | -- | $64,447 | $12,210 | $52,237 |
Source: Public Records
Map
Nearby Homes
- 7407 Southworth Cir Unit 6
- 7311 Fordham Ln
- 1713 Burshire Dr
- 1817 Burshire Ct
- 7651 Pin Oak Ct
- 1702 Waterman Dr
- Townsend Plan at Lakewood Prairie - Single Family
- Meadowlark Plan at Lakewood Prairie - Single Family
- Wren Plan at Lakewood Prairie - Single Family
- Siena II Plan at Lakewood Prairie - Single Family
- Starling Plan at Lakewood Prairie - Single Family
- 7202 Faxton Ln
- 7605 Sassafras Ln
- 2002 Havenhill Dr
- 1910 Crestview Dr Unit 2
- 7514 Blueblossom Ln
- 7512 Blueblossom Ln
- 7502 Currant Dr
- 7509 Currant Dr
- 7506 Currant Dr
- 7405 Fordham Ct Unit 1
- 7409 Fordham Ct
- 1714 Prairieside Dr Unit 1
- 7403 Fordham Ct Unit 1
- 7411 Fordham Ln Unit 1
- 1716 Prairieside Dr
- 7405 Southworth Cir Unit 6
- 7409 Southworth Cir Unit 6
- 7401 Fordham Ln
- 7403 Southworth Cir
- 7413 Fordham Ln
- 7411 Southworth Cir
- 1710 Prairieside Dr
- 7423 Westbrook Dr Unit 1
- 7401 Southworth Cir
- 7319 Fordham Ln
- 7413 Southworth Cir
- 7415 Fordham Ln
- 7402 Fordham Ln
Your Personal Tour Guide
Ask me questions while you tour the home.