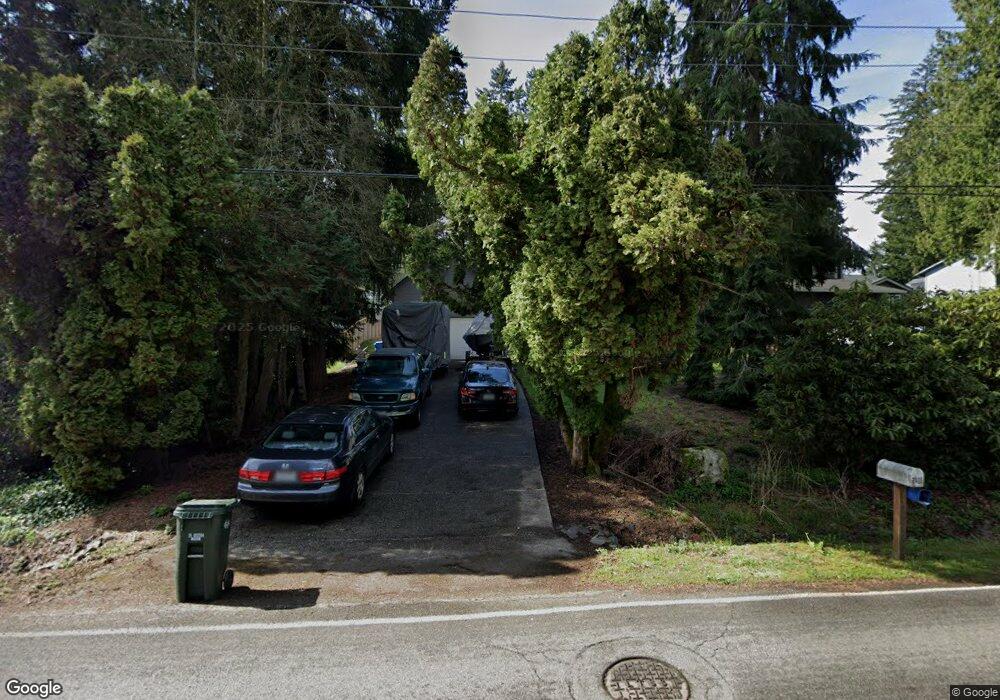
7408 Vandermark Rd E Bonney Lake, WA 98391
Estimated Value: $580,000 - $761,000
3
Beds
3
Baths
1,611
Sq Ft
$398/Sq Ft
Est. Value
About This Home
This home is located at 7408 Vandermark Rd E, Bonney Lake, WA 98391 and is currently estimated at $640,868, approximately $397 per square foot. 7408 Vandermark Rd E is a home located in Pierce County with nearby schools including Emerald Hills Elementary School, Lakeridge Middle School, and Bonney Lake High School.
Ownership History
Date
Name
Owned For
Owner Type
Purchase Details
Closed on
Nov 5, 2024
Sold by
Kiening Richard H
Bought by
Wholly Owned Richard H Kiening Revocable Livi and Kiening
Current Estimated Value
Purchase Details
Closed on
Nov 6, 2018
Sold by
Kiening Richard
Bought by
Ivey Jennifer R
Purchase Details
Closed on
Apr 13, 2018
Sold by
Hansen Dave and Estate Of Harold Storm
Bought by
Kiening Richard
Home Financials for this Owner
Home Financials are based on the most recent Mortgage that was taken out on this home.
Original Mortgage
$105,000
Interest Rate
4.46%
Mortgage Type
Purchase Money Mortgage
Purchase Details
Closed on
May 10, 1996
Sold by
Kiening Richard and Kiening Sandra
Bought by
Storm Harold J
Home Financials for this Owner
Home Financials are based on the most recent Mortgage that was taken out on this home.
Original Mortgage
$111,000
Interest Rate
7.68%
Mortgage Type
Seller Take Back
Create a Home Valuation Report for This Property
The Home Valuation Report is an in-depth analysis detailing your home's value as well as a comparison with similar homes in the area
Home Values in the Area
Average Home Value in this Area
Purchase History
| Date | Buyer | Sale Price | Title Company |
|---|---|---|---|
| Wholly Owned Richard H Kiening Revocable Livi | -- | None Listed On Document | |
| Ivey Jennifer R | $13,469 | None Available | |
| Kiening Richard | $104,719 | None Available | |
| Storm Harold J | $161,340 | -- |
Source: Public Records
Mortgage History
| Date | Status | Borrower | Loan Amount |
|---|---|---|---|
| Previous Owner | Kiening Richard | $105,000 | |
| Previous Owner | Storm Harold J | $111,000 |
Source: Public Records
Tax History Compared to Growth
Tax History
| Year | Tax Paid | Tax Assessment Tax Assessment Total Assessment is a certain percentage of the fair market value that is determined by local assessors to be the total taxable value of land and additions on the property. | Land | Improvement |
|---|---|---|---|---|
| 2025 | $4,922 | $539,500 | $253,500 | $286,000 |
| 2024 | $4,922 | $521,100 | $224,600 | $296,500 |
| 2023 | $4,922 | $483,900 | $224,600 | $259,300 |
| 2022 | $1,855 | $518,500 | $234,500 | $284,000 |
| 2021 | $2,078 | $369,000 | $153,600 | $215,400 |
| 2019 | $1,727 | $330,600 | $140,400 | $190,200 |
| 2018 | $3,951 | $315,200 | $130,500 | $184,700 |
| 2017 | $3,385 | $281,900 | $109,200 | $172,700 |
| 2016 | $2,909 | $224,700 | $84,800 | $139,900 |
| 2014 | $2,588 | $205,700 | $69,300 | $136,400 |
| 2013 | $2,588 | $182,600 | $62,700 | $119,900 |
Source: Public Records
Map
Nearby Homes
- 21205 Connells Prairie Rd E
- 7802 211th Ave E
- 7806 211th Ave E
- 7010 Vandermark Rd E
- 7013 Vandermark Rd E
- 21010 68th Street Ct E
- 21016 67th Street Ct E
- 21004 67th Street Ct E
- 21005 67th Street Ct E
- 21017 67th Street Ct E
- 6520 213th Avenue Ct E
- 6602 213th Avenue Ct E
- 20705 64th St E
- 6504 213th (Lot 6) Avenue Ct E
- 7512 222nd Avenue Ct E
- 6414 213th (Lot 4) Avenue Ct E
- 8414 214th Ave E
- 6406 213th (Lot 2) Avenue Ct E
- 20221 Church Lake Rd E
- 7711 202nd Ave E
- 7424 Vandermark Rd E
- 7406 Vandermark Rd E
- 7410 Vandermark Rd E
- 21111 75th St E
- 7404 Vandermark Rd E
- 7412 Vandermark Rd E
- 21107 75th St E
- 7402 Vandermark Rd E
- 7414 Vandermark Rd E
- 7407 Vandermark Rd E
- 21103 75th St E
- 7409 Vandermark Rd E
- 7416 Vandermark Rd E
- 7314 Vandermark Rd E
- 7411 Vandermark Rd E
- 21114 75th St E
- 7401 Vandermark Rd E
- 21101 75th St E
- 21106 Church Lake Dr E
- 21108 Church Lake Dr E