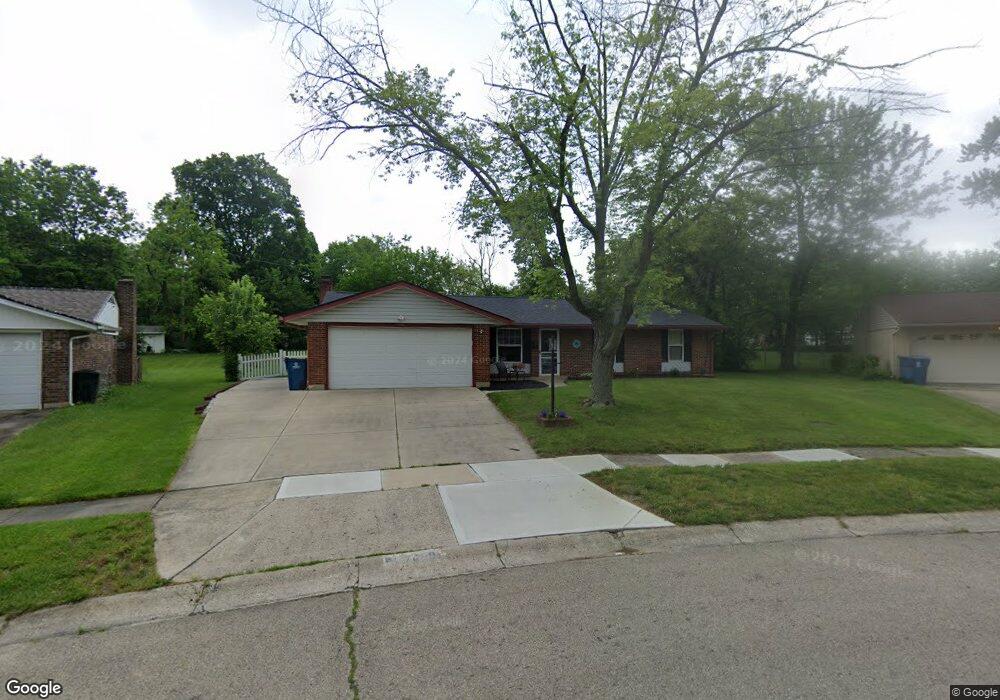
7409 Treon Place Dayton, OH 45424
Estimated Value: $188,000 - $208,534
3
Beds
2
Baths
1,239
Sq Ft
$159/Sq Ft
Est. Value
About This Home
This home is located at 7409 Treon Place, Dayton, OH 45424 and is currently estimated at $196,384, approximately $158 per square foot. 7409 Treon Place is a home located in Montgomery County with nearby schools including Wayne High School and Huber Heights Christian Academy.
Ownership History
Date
Name
Owned For
Owner Type
Purchase Details
Closed on
May 5, 2017
Sold by
Pearson Marjorie Ann
Bought by
Pearson Annette M
Current Estimated Value
Home Financials for this Owner
Home Financials are based on the most recent Mortgage that was taken out on this home.
Original Mortgage
$85,500
Outstanding Balance
$71,104
Interest Rate
4.1%
Mortgage Type
New Conventional
Estimated Equity
$125,280
Purchase Details
Closed on
May 20, 2005
Sold by
Benson Jacob P and Benson Stacey M
Bought by
Pearson Marjorie Ann
Home Financials for this Owner
Home Financials are based on the most recent Mortgage that was taken out on this home.
Original Mortgage
$92,000
Interest Rate
6.07%
Mortgage Type
Fannie Mae Freddie Mac
Purchase Details
Closed on
May 11, 1998
Sold by
Engle Donald L
Bought by
Benson Jacob P and Benson Stacey M
Create a Home Valuation Report for This Property
The Home Valuation Report is an in-depth analysis detailing your home's value as well as a comparison with similar homes in the area
Home Values in the Area
Average Home Value in this Area
Purchase History
| Date | Buyer | Sale Price | Title Company |
|---|---|---|---|
| Pearson Annette M | $95,000 | American Homeland Title | |
| Pearson Marjorie Ann | $115,000 | -- | |
| Benson Jacob P | $99,000 | -- | |
| Benson Jacob P | $99,000 | -- |
Source: Public Records
Mortgage History
| Date | Status | Borrower | Loan Amount |
|---|---|---|---|
| Open | Pearson Annette M | $85,500 | |
| Previous Owner | Pearson Marjorie Ann | $92,000 |
Source: Public Records
Tax History Compared to Growth
Tax History
| Year | Tax Paid | Tax Assessment Tax Assessment Total Assessment is a certain percentage of the fair market value that is determined by local assessors to be the total taxable value of land and additions on the property. | Land | Improvement |
|---|---|---|---|---|
| 2024 | $2,801 | $54,310 | $10,150 | $44,160 |
| 2023 | $2,801 | $54,310 | $10,150 | $44,160 |
| 2022 | $2,448 | $37,410 | $7,000 | $30,410 |
| 2021 | $2,483 | $37,410 | $7,000 | $30,410 |
| 2020 | $2,485 | $37,410 | $7,000 | $30,410 |
| 2019 | $2,517 | $33,530 | $7,000 | $26,530 |
| 2018 | $2,526 | $33,530 | $7,000 | $26,530 |
| 2017 | $2,509 | $33,530 | $7,000 | $26,530 |
| 2016 | $2,373 | $30,920 | $7,000 | $23,920 |
| 2015 | $2,343 | $30,920 | $7,000 | $23,920 |
| 2014 | $2,343 | $30,920 | $7,000 | $23,920 |
| 2012 | -- | $34,320 | $9,630 | $24,690 |
Source: Public Records
Map
Nearby Homes
- 6605 Highbury Rd
- 7371 Damascus Dr
- 6601 Grovehill Dr
- 6701 Springport Way
- 6681 Spokane Dr
- 6447 Highbury Rd
- 6811 Highbury Rd
- 6245 Longford Rd
- 7150 Harshmanville Rd
- 7126 Mandrake Dr
- 6946 Hubbard Dr
- 7741 Shalamar Dr
- 7866 Harshmanville Rd
- 7854 Harshmanville Rd
- 6150 Taylorsville Rd
- 7611 Shepherdess Dr
- 7061 Rio Vista Ct
- 6960 Serene Place
- 7660 Stonecrest Dr
- 6800 Cicero Ct
- 7405 Treon Place
- 7413 Treon Place
- 7417 Treon Place
- 6488 Taylorsville Rd
- 7408 Treon Place
- 6575 Highbury Rd
- 6571 Highbury Rd
- 6500 Taylorsville Rd
- 6430 Taylorsville Rd
- 6567 Highbury Rd
- 7418 Treon Place
- 7421 Treon Place
- 7400 Treon Place
- 6563 Highbury Rd
- 6587 Highbury Rd
- 7422 Treon Place
- 6524 Taylorsville Rd
- 7425 Treon Place
- 6559 Highbury Rd
- 6576 Highbury Rd