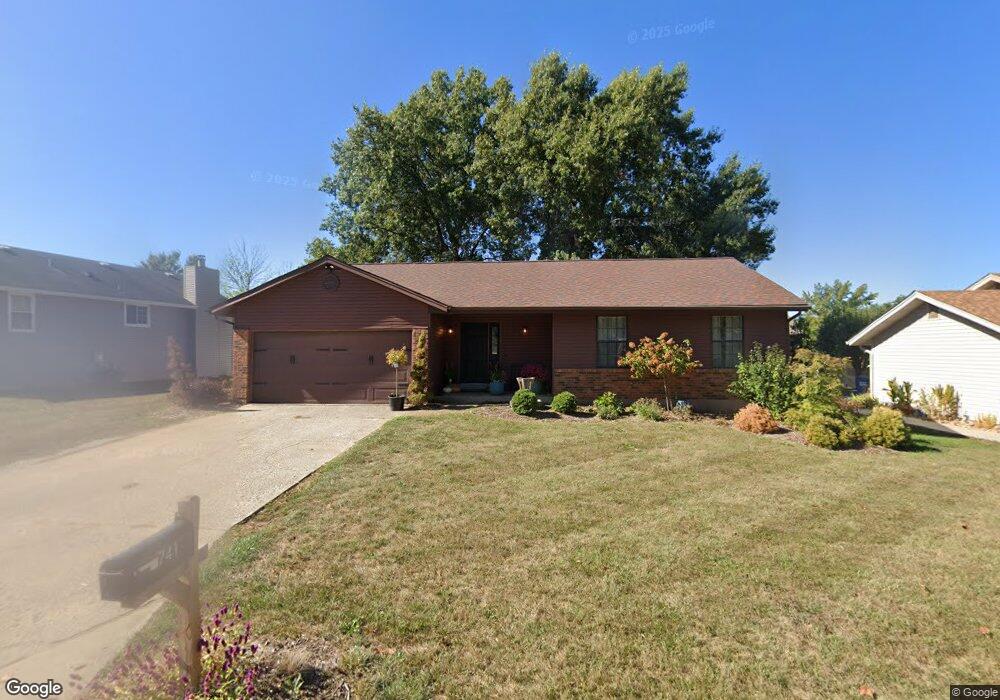
741 Cedar Glen Dr Weldon Spring, MO 63304
Estimated Value: $354,000 - $480,333
3
Beds
2
Baths
1,281
Sq Ft
$302/Sq Ft
Est. Value
About This Home
This home is located at 741 Cedar Glen Dr, Weldon Spring, MO 63304 and is currently estimated at $387,333, approximately $302 per square foot. 741 Cedar Glen Dr is a home located in St. Charles County with nearby schools including Independence Elementary School, Francis Howell Middle School, and Francis Howell Union High School.
Ownership History
Date
Name
Owned For
Owner Type
Purchase Details
Closed on
Mar 31, 2022
Sold by
Swap 44 Llc
Bought by
Clark Sean and Evola Stori
Current Estimated Value
Home Financials for this Owner
Home Financials are based on the most recent Mortgage that was taken out on this home.
Original Mortgage
$242,250
Outstanding Balance
$228,531
Interest Rate
4.67%
Mortgage Type
New Conventional
Estimated Equity
$158,802
Purchase Details
Closed on
Mar 18, 2022
Sold by
Mann Thomas J and Mann Kathleen
Bought by
Swap 44 Llc
Home Financials for this Owner
Home Financials are based on the most recent Mortgage that was taken out on this home.
Original Mortgage
$242,250
Outstanding Balance
$228,531
Interest Rate
4.67%
Mortgage Type
New Conventional
Estimated Equity
$158,802
Purchase Details
Closed on
Jan 13, 2022
Sold by
Mann John K
Bought by
Mann Thomas J
Purchase Details
Closed on
Dec 12, 2014
Sold by
Mann John K
Bought by
Mann Thomas J and Mann John K
Create a Home Valuation Report for This Property
The Home Valuation Report is an in-depth analysis detailing your home's value as well as a comparison with similar homes in the area
Home Values in the Area
Average Home Value in this Area
Purchase History
| Date | Buyer | Sale Price | Title Company |
|---|---|---|---|
| Clark Sean | -- | None Listed On Document | |
| Swap 44 Llc | -- | True Title | |
| Mann Thomas J | -- | True Title | |
| Mann Thomas J | -- | None Listed On Document | |
| Mann Thomas J | -- | None Available |
Source: Public Records
Mortgage History
| Date | Status | Borrower | Loan Amount |
|---|---|---|---|
| Open | Clark Sean | $242,250 | |
| Closed | Swap 44 Llc | $238,000 |
Source: Public Records
Tax History
| Year | Tax Paid | Tax Assessment Tax Assessment Total Assessment is a certain percentage of the fair market value that is determined by local assessors to be the total taxable value of land and additions on the property. | Land | Improvement |
|---|---|---|---|---|
| 2025 | $2,743 | $51,957 | -- | -- |
| 2023 | $2,742 | $45,791 | -- | -- |
| 2022 | $2,441 | $37,828 | $0 | $0 |
| 2021 | $2,443 | $37,828 | $0 | $0 |
| 2020 | $2,307 | $34,561 | $0 | $0 |
| 2019 | $2,297 | $34,561 | $0 | $0 |
| 2018 | $2,195 | $31,570 | $0 | $0 |
| 2017 | $2,177 | $31,570 | $0 | $0 |
| 2016 | $2,049 | $28,593 | $0 | $0 |
| 2015 | $2,017 | $28,593 | $0 | $0 |
| 2014 | $1,799 | $24,741 | $0 | $0 |
Source: Public Records
Map
Nearby Homes
- 1401 Hemingway Ln Unit H
- 1704 Hemingway Ln Unit B
- 1 Belcourt Cir
- 1005 Waldo Ln
- 323 Wildberry Ln
- 32 Weldon Spring Heights Dr
- 14 Walnut Hill Ct
- 2927 Bromley Dr
- 1218 Saddlemaker Dr
- 784 River Glen Dr
- 1317 Auburn Hills Dr
- 627 W Falls Ct
- 41 Wolfrum Rd
- 1334 Auburn Hills Dr
- 73 Morgantown Ct
- 2143 Alexandria Row
- 202 Keaton Woods Dr
- 202 Ella Rose Ln
- 201 Keaton Woods Dr
- 204 Ella Rose Ln
- 745 Cedar Glen Dr
- 737 Cedar Glen Dr
- 852 Hemingway Ln
- 852 Hemingway Ln Unit G
- 852 Hemingway Ln Unit 852
- 855 Hemingway Ln
- 857 Hemingway Ln
- 857 Hemingway Ln Unit C
- 854 Hemingway Ln
- 851 Hemingway Ln
- 749 Cedar Glen Dr
- 856 Hemingway Ln Unit D
- 856 Hemingway Ln
- 733 Cedar Glen Dr
- 853 Hemingway Ln
- 859 Hemingway Ln
- 859 Hemingway Ln Unit A
- 736 Cedar Glen Dr
- 858 Hemingway Ln
- 740 Cedar Glen Dr
Your Personal Tour Guide
Ask me questions while you tour the home.